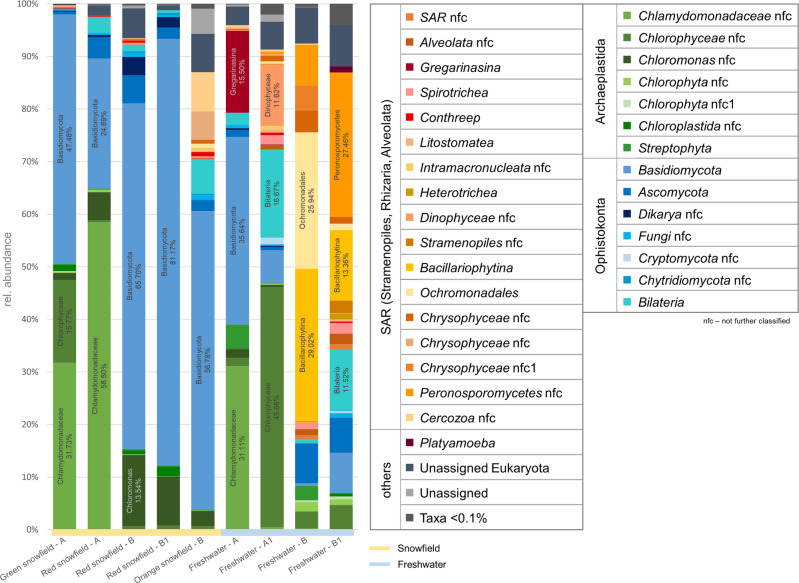
Fig. 2. Taxonomic classification of the eukaryotic community inhabiting differently colored snowfields and freshwater sampled at two geographically distant locations in the Austrian Alps.
Bar charts represent the prevailing fraction of the eukaryotic community with a relative occurrence ≥0.1% in the whole dataset. Sampling site A: Rottenmanner Tauern; sampling site B: Seetaler Alpen. Labels and the relative abundances of highly abundant taxa (>10% rel. abundance) are included in the respective bar chart.

