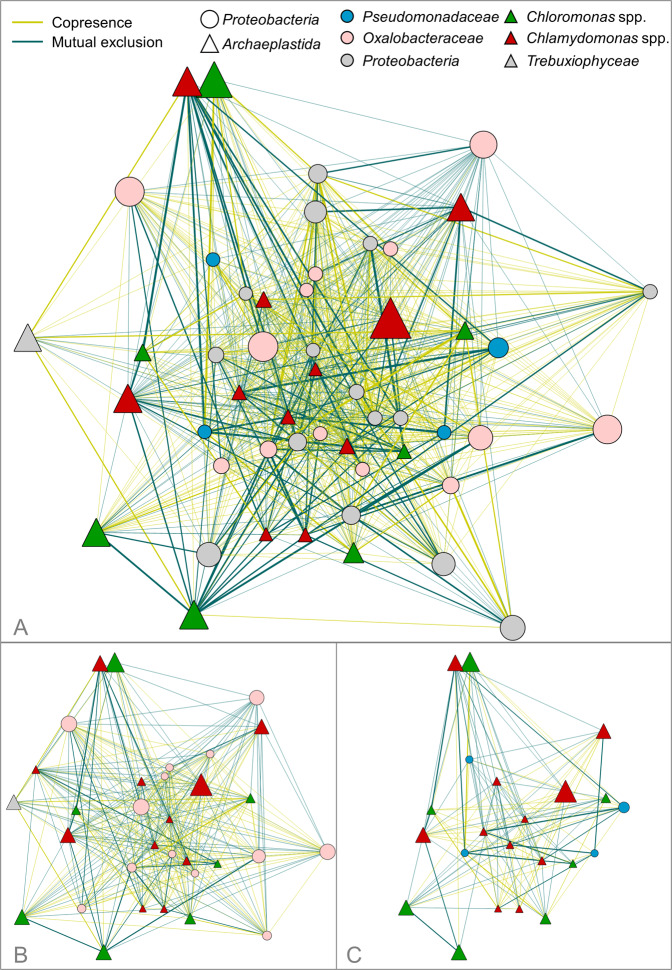
Fig. 5. Co-occurrence network analyses of bacterial and eukaryotic taxa found on differently colored snowfields.
Significant (p < 0.0004; q < 0.0004) co-occurrences (blue edges) and mutual-exclusion patterns (yellow edges) between features assigned to Proteobacteria and Archaeplastida (a) are displayed. The node size corresponds to the relative abundance of respective taxa. The edge width indicates the significance of interactions. The co-occurrence network was reduced in order to highlight interactions between algae and Oxalobacteraceae (b) and Pseudomonadaceae (c).

