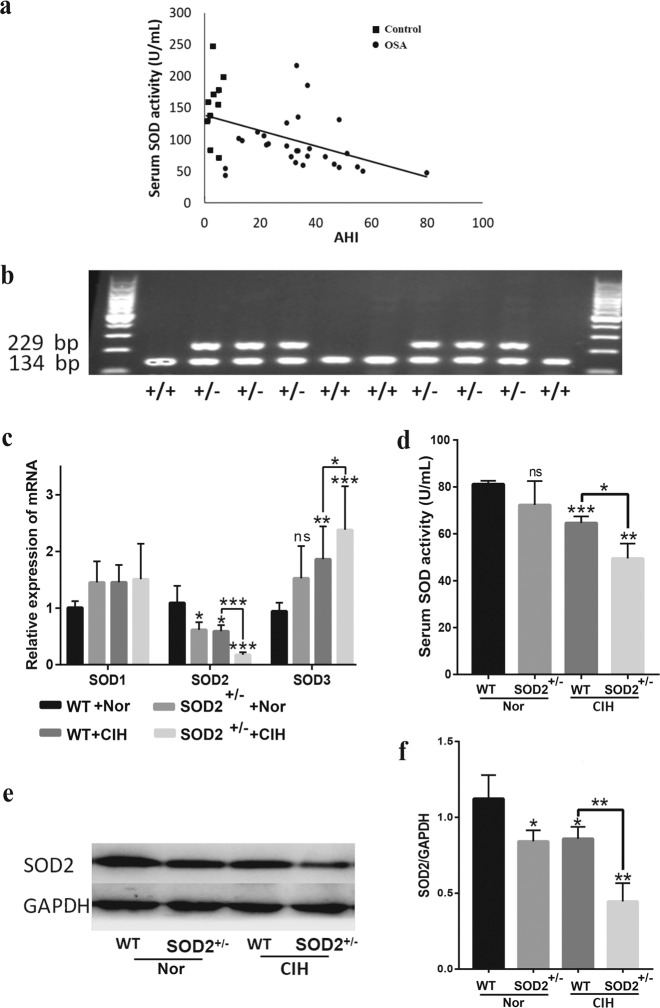
Fig. 1. Expression and activity of superoxide dismutase in OSA patients and CIH-treated mice.
a ELISA analysis was performed to investigate the correlation between the AHI and SOD2 activity in serum samples from ten control individuals and 29 OSA patients. b Total DNA was used as a template for genotyping SOD2+/− and WT mice. The amplification of a 229-bp band indicated the integration with the SOD2 gene. c Reverse transcription quantitative PCR (RT-qPCR) evaluation of the pulmonary mRNA levels of SOD1, SOD2 and SOD3 was performed with the lungs of WT and SOD2+/− mice exposed to Nor or CIH. d SOD levels in serum samples collected from the four mouse groups were detected by ELISA. e Representative Western blot images for the pulmonary levels of SOD2 and GAPDH are shown. f Densitometric quantification of relative SOD2 expression is shown. We analyzed more than six individual mouse serum or tissue samples in every experiment. Independent experiments were repeated three times, and a representative figure is shown. The data are shown as the mean ± SEM of one experiment with six mice. *P < 0.05, **P < 0.01, and ***P < 0.001 compared with the WT group. WT wild type, AHI apnea hypoxia index, Nor normoxia, CIH chronic intermittent hypoxia.

