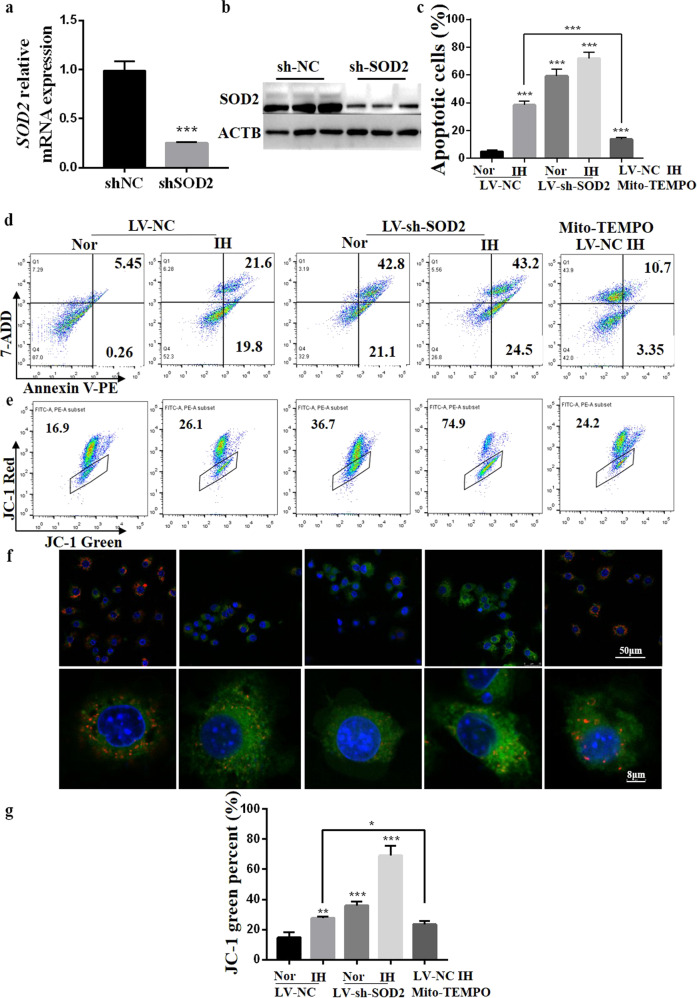
Fig. 6. Detection of apoptosis and mitochondrial membrane potential in LV-NC- or LV-shSOD2-transfected RAW264.7 cells incubated for 48 h under Nor or IH conditions with or without mito-TEMPO (100 nM).
a Raw264.7 cells were transfected with LV-NC or LV-shSOD2. Cell lysates were subjected to real-time PCR (a) and Western blotting for SOD2 (b). ACTB (β-actin) was used as the loading control. c The percentage of apoptotic cells in five groups was detected by FACS analysis. d Representative graphs of flow cytometric analysis of apoptosis are shown. e Representative graphs of flow cytometric analysis after incubation with JC-1 are shown. f Merged confocal microscopy images of RAW254.7 cells show the colocalization of JC-1 aggregates (red fluorescence represents JC-1 aggregates in healthy mitochondria) and JC-1 monomers (green fluorescence represents JC-1 monomers, indicating mitochondrial membrane potential dissipation). g Changes in mitochondrial membrane potential are represented as the green fluorescence ratio. All data are presented as the mean ± SEM. *P < 0.05, **P < 0.01 and ***P < 0.001 compared with the control group. Every experiment was repeated at least three times. IH intermittent hypoxia.

