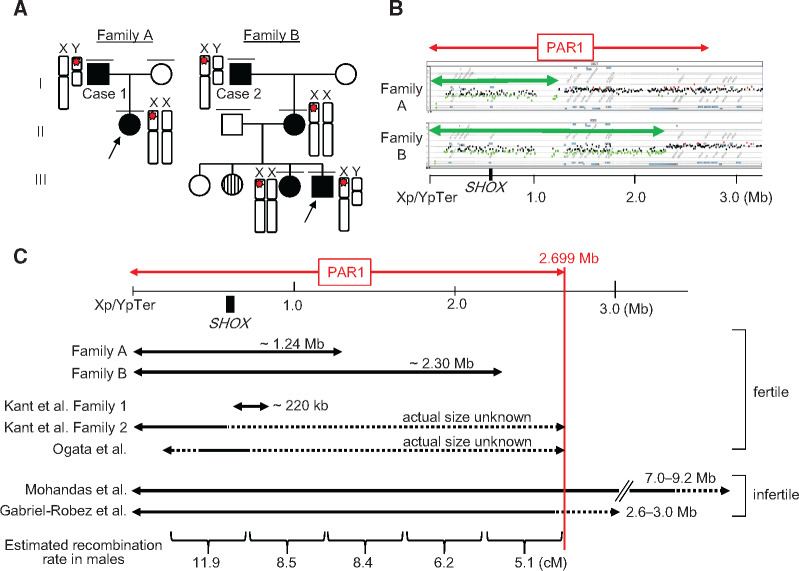
Fig. 1.
Molecular findings of families A and B. (A) The pedigrees of families A and B. Black boxes and circles indicate individuals with mesomelic short stature and/or skeletal deformities, whereas the white box and circles depict unaffected family members. The striped circle indicates an individual with short stature, whose genomic DNA sample and detailed clinical information were unavailable. Red stars on the X and Y chromosomes indicate SHOX-containing deletions in the pseudoautosomal region 1 (PAR1). (B) Representative results of microarray-based comparative genomic hybridization for the probands of families A and B. PAR1 is indicated by the red arrow. Black, green, and red dots denote signals indicative of the normal, decreased (<−0.8) and increased (>+0.4) copy numbers, respectively. Green arrows indicate the deleted regions in families A and B. Genomic positions refer to the human genome database (GRCh37/hg19). The position of SHOX is indicated by the black box. (C) Schematic representation of PAR1. The deleted regions in families A and B, together with those in the three previously reported cases with normal fertility (Ogata et al. 2002; Kant et al. 2011) and two cases with spermatogenic failure (Gabriel-Robez et al. 1990; Mohandas et al. 1992), are shown as black arrows. The broken lines depict dosage-unknown regions. The position of SHOX is indicated by the black box. The panel at the bottom shows the recombination rates of normal males (in cM) calculated by Hinch et al. (2014).

