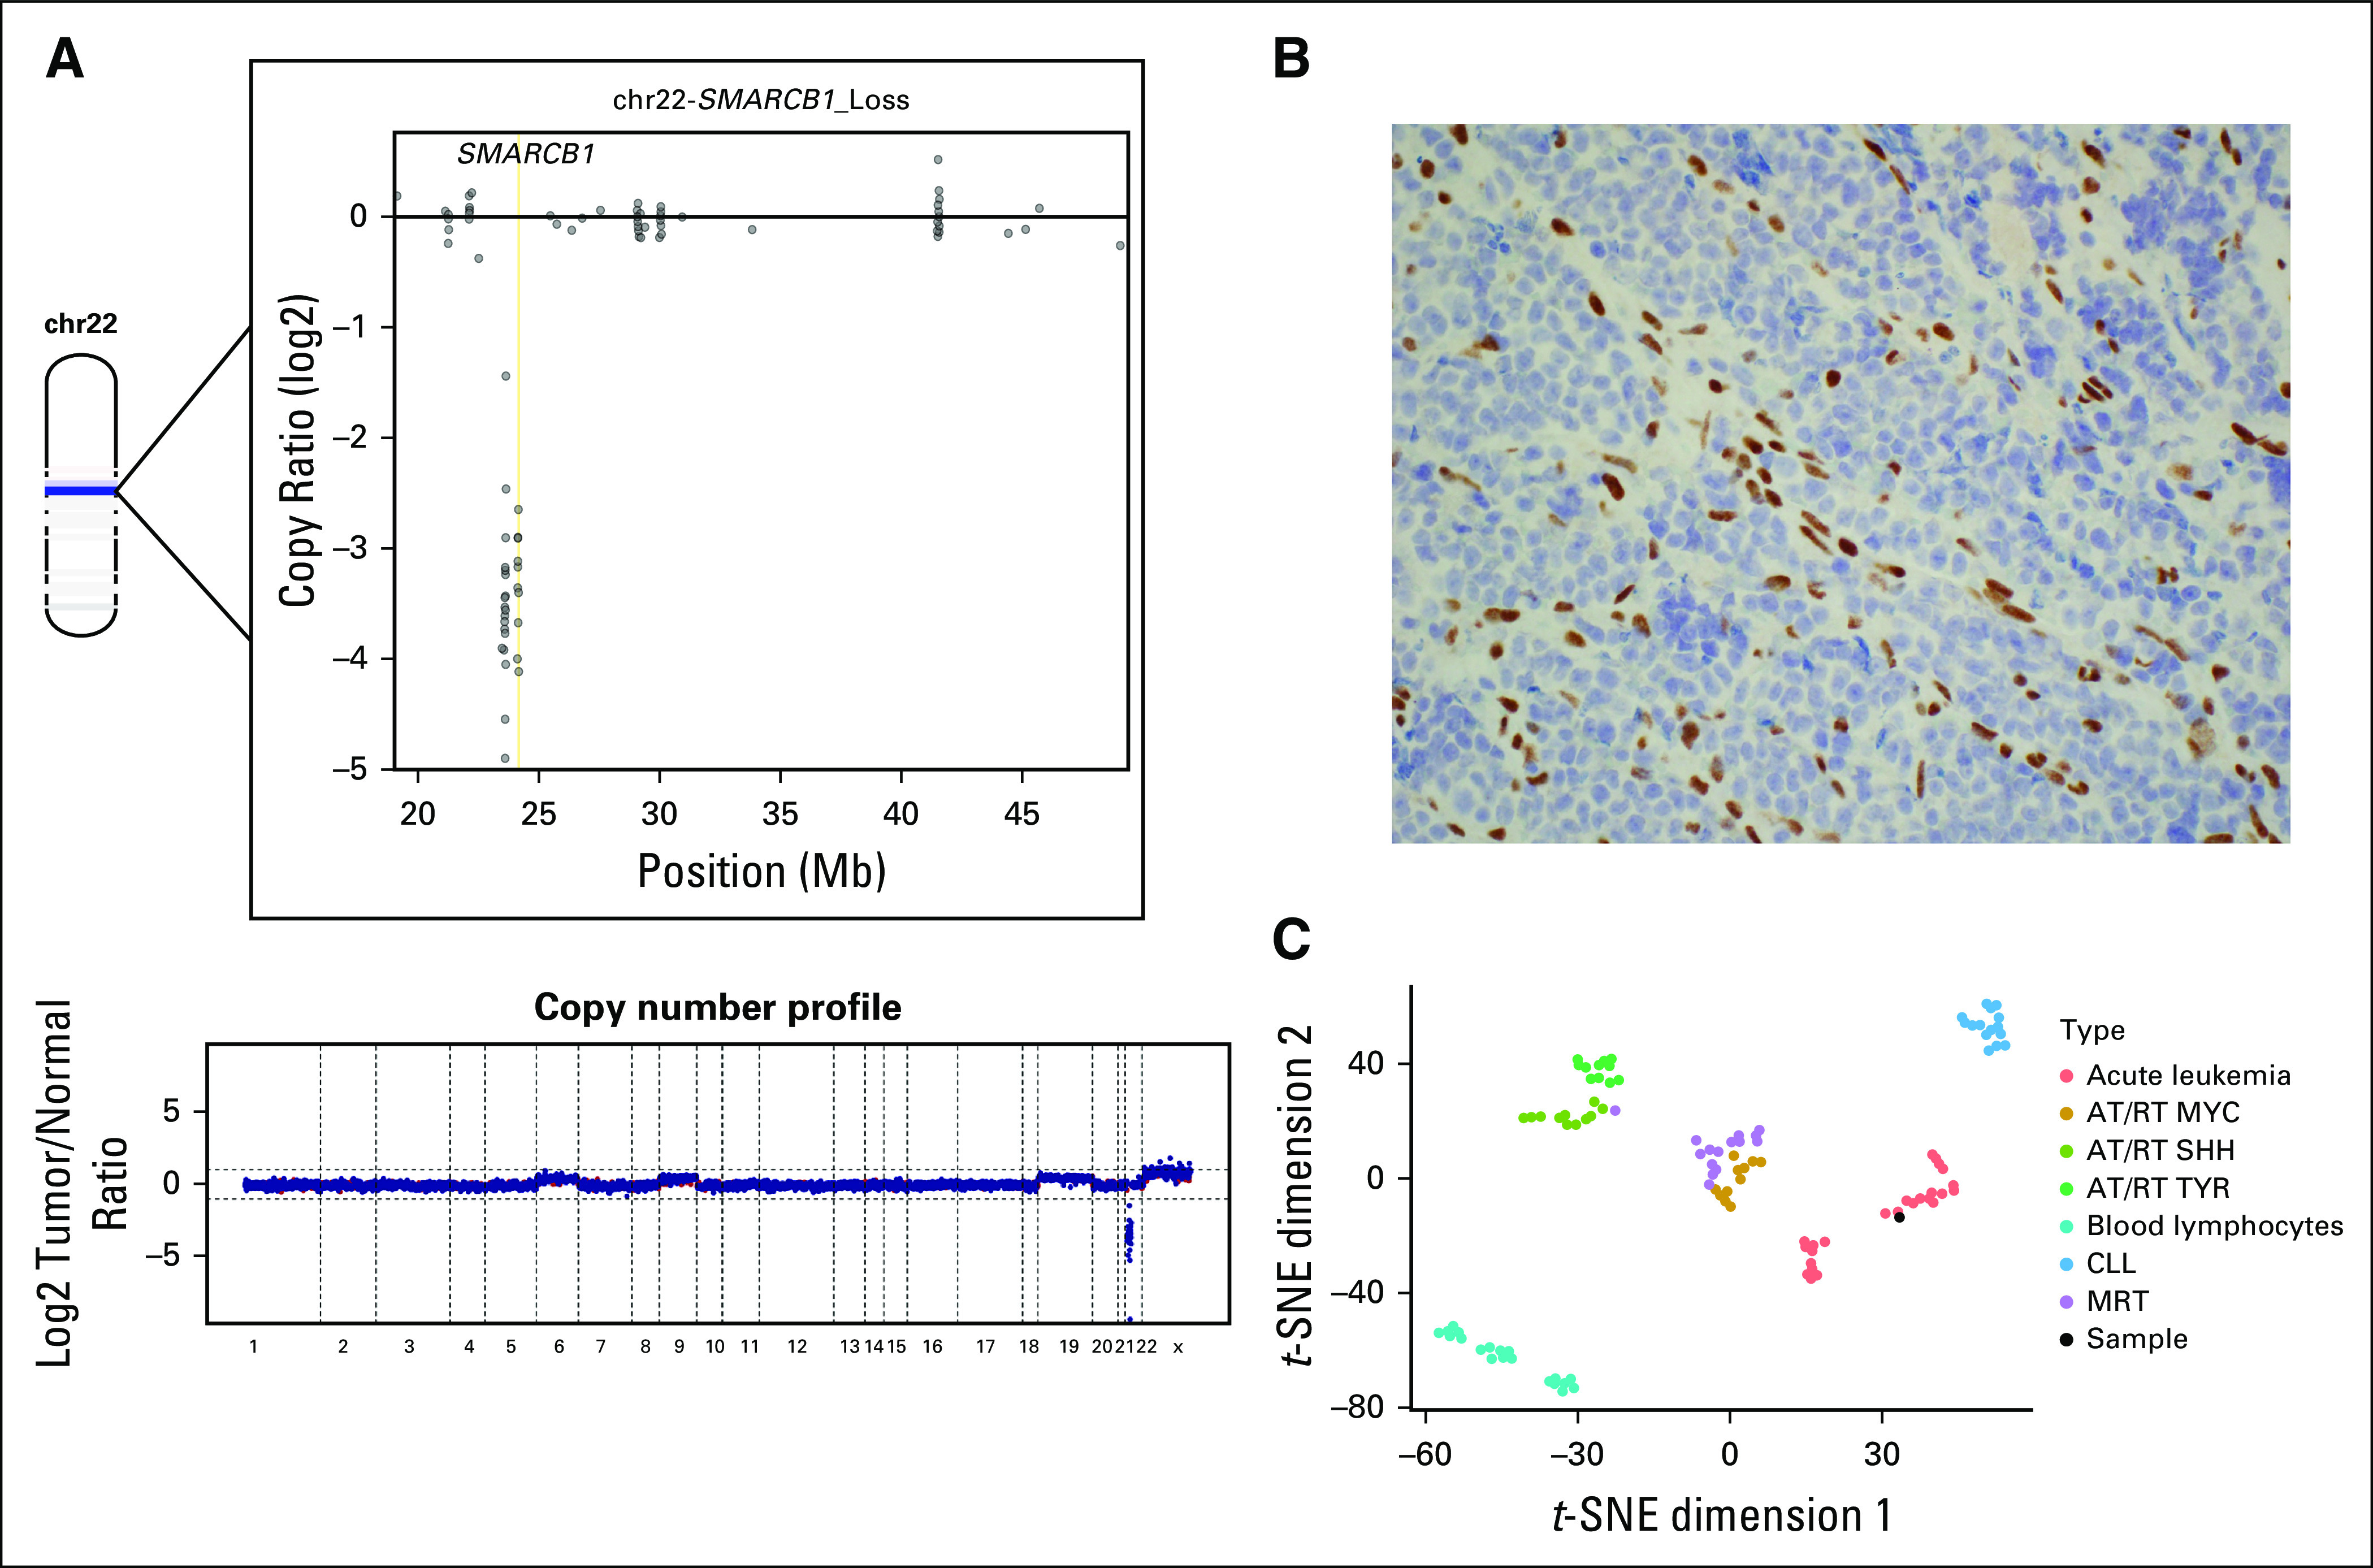
FIG 3.

(A) The bottom part of the figure represents the genome wide copy number profile based on log2 copy number coverages at exon locations covered by the MSK IMPACT platform. Chromosome 22 (chr22) is depicted in the upper left part of the figure, with a dark blue band representing the location and loss of SMARCB1. The upper right part of the figure demonstrates log2 copy number coverages at exon locations across chr22, demonstrating complete loss of SMARCB1 at all exon locations. (B) Neoplastic cells showed aberrant loss of INI1 expression, whereas endothelial cells had normal expression of INI1 (INI1/BAF-47 immunohistochemistry, ×400). (C) t-Distributed Stochastic Neighbor Embedding (t-SNE) analysis of methylation array data demonstrated localization of the patient’s sample within the acute leukemia cluster rather than with other SMARCB1-deficient entity clusters. AT/RT, atypical teratoid rhabdoid tumor; CLL, chronic lymphocytic leukemia; MRT, malignant rhabdoid tumor.
