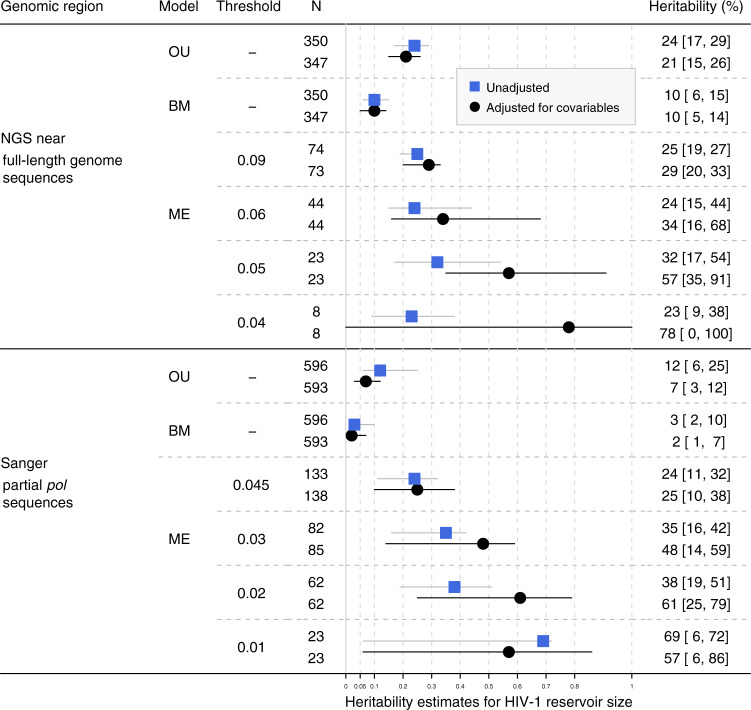
Fig. 2. Heritability estimates for HIV-1 reservoir size based on the phylogenies built from near full-length HIV-1 genome NGS sequences and partial pol Sanger sequences.
OU: Ornstein Uhlenbeck model. BM: Brownian motion model. ME: Mixed-effect model with corresponding phylogenetic distance threshold (substitutions per site). N: Number of patients included in the analysis. Patients with incomplete information of potential covariables were excluded. For BM and OU, all eligible patients from the tree were included while for mixed-effect model, only patients in the extracted transmission clusters were included. Black dots and black confidence intervals show the heritability estimates adjusted for covariables while blue rectangles and gray confidence intervals show the unadjusted estimates. 95% confidence intervals are shown in square brackets.

