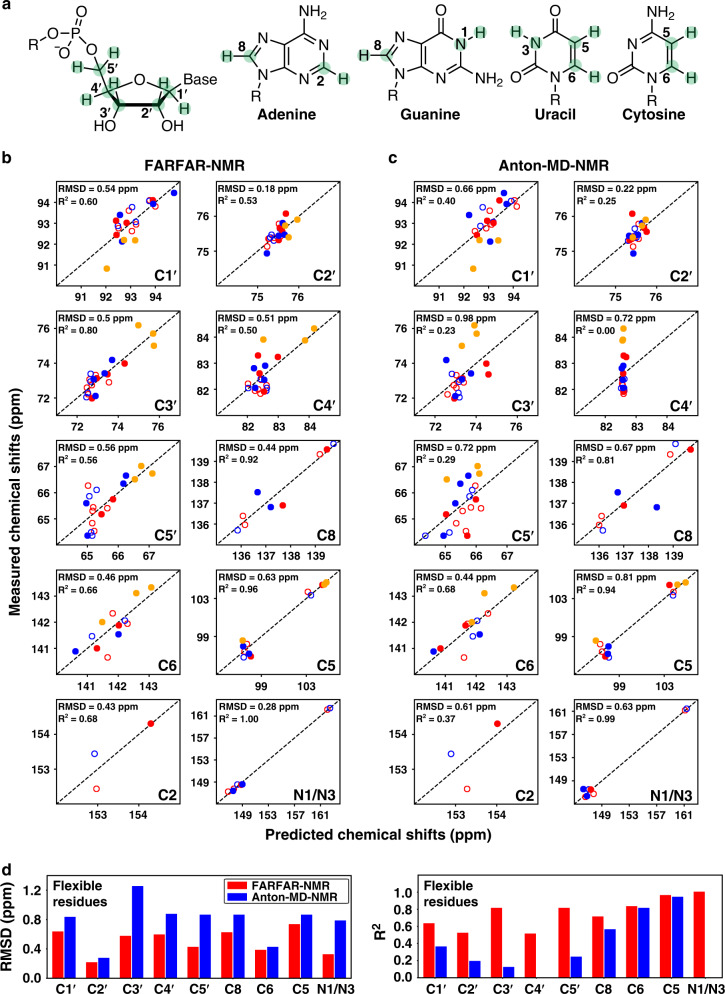
Fig. 3. Evaluating TAR ensembles using chemical shifts.
a Chemical structures of the sugar and base moieties with chemical shift probes used to test ensemble accuracy highlighted in green. b, c Comparison of measured and predicted 13C/15N chemical shifts for b FARFAR-NMR (N = 20) and c Anton-MD-NMR (N = 20) by AF-QM/MM (“Methods”). Values are color-coded according to the structural elements in Fig. 2a. Chemical shifts for central Watson–Crick bps within A-form helices (C19-G43, A20-U42, G21-C41, A27-U38, G28-C37) are denoted using open circles. A correction was applied to the predicted chemical shifts (“Methods”) as described previously29. For 1H chemical shifts see Supplementary Fig. 3. d Comparison of RMSD (left) and R2 (right) between measured and predicted 13C/15N chemical shifts for flexible residues (U23, C24, U25, A22-U40, G26-C39, C29-G36, G18-C44) for FARFAR-NMR (red) and Anton-MD-NMR (blue).

