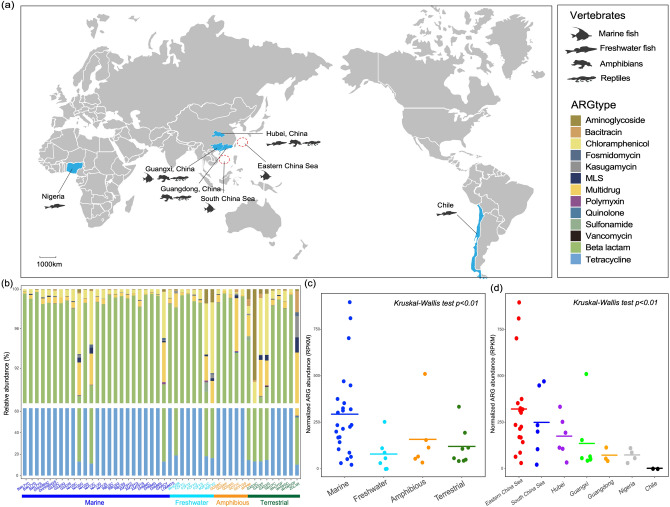
Figure 1.
Antibiotic resistome in vertebrate meta-transcriptomic libraries. (a) Sample locations and sample types of the meta-transcriptomic data obtained here. (b) Relative abundance of ARG types in each library. Colors for each ARG type are presented in the top right panel of the figure. MLS, macrolide, lincosamide and streptogramin. (c–d) Total ARG abundance (RPKM) per library, stratified by habitat (c) and sampling site (d). Cross bars indicate the mean values. Differences between groups were estimated using a Kruskal–Wallis test.

