Figure 1.
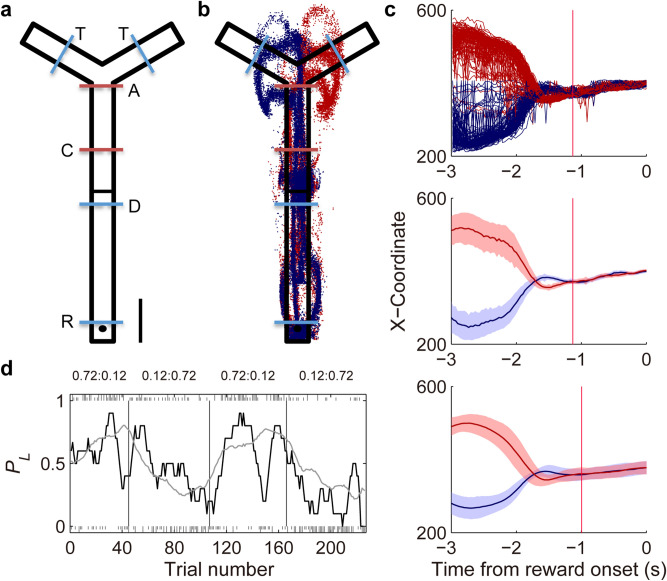
Behavior. (a) A modified T-maze. A trial began when the animal arrived at the delay point (D) from the proximal side of the central stem. Following a 2-s delay at the delay point, the animal was allowed to choose freely between two targets (T) and return to the reward location (R) where water reward was delivered probabilistically according to the animal’s choice. Blue dashed lines denote photobeam sensors. ‘A’ (approach) and ‘C’ (convergence) denote approximate spatial positions for the divergence (outbound) and convergence (inbound) of left and right target-associated movement trajectories, respectively. (b) Movement trajectories in a sample session. Blue, left choice; red, right choice. Each dot represent the animal’s head position at 33.3 ms time resolution. (c) Determination of the time of memory stage onset. The onset of memory stage was determined separately for each session according to the animal’s movement trajectories. The graphs show the time course of X-coordinates of animal’s position data during the 3-s time period before reward stage onset (time 0). The onset of memory stage (red vertical lines) was when the difference in X-coordinates of the left- and right-choice trajectories became statistically insignificant (t-test, p > 0.05) and maintained that way for at least three consecutive time points (100 ms). Top, X-coordinates of all return trajectories following left and right target choices (blue and red, respectively) during the sample session. Middle, mean (± SD across trials) X-coordinates of return trajectories for the same session. Bottom, mean X-coordinates of return trajectories averaged across sessions (± SD; n = 41). (d) Choice behavior during the sample recording session. Tick marks indicate the actual choices of the animal (upper, left choice; lower, right choice; long, rewarded; short, unrewarded). Vertical solid lines indicate block transitions. Numbers on the top denote mean reward probabilities following left and right choices in each block. The gray line shows the probability to choose the left target (PL) predicted by the Q-learning model. The black line shows the actual PL in a moving average of 10 trials.

