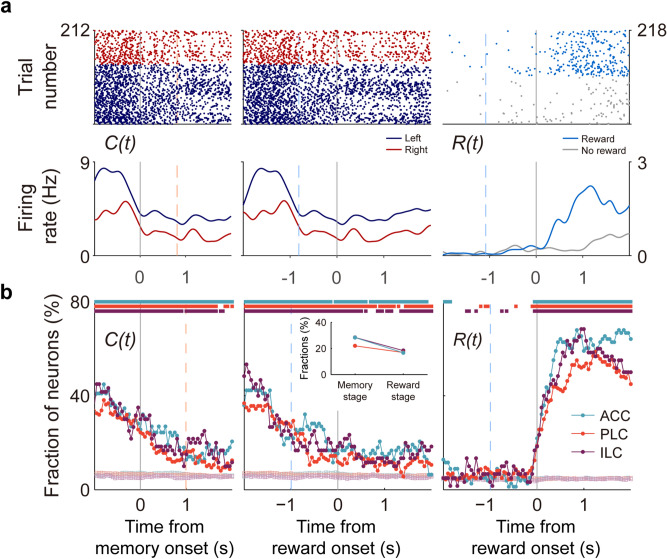
Figure 3.
Neural activity related to choice and outcome. (a) Sample neurons coding the animal’s choice [C(t)] during the memory stage (left) or choice outcome [R(t)] during the reward stage (right). Orange and light blue dashed lines, onset times of the reward and memory stages, respectively. (b) Population data showing temporal profiles of choice and outcome signals during the memory and reward stages. Shown are fractions of neurons significantly responsive to a given variable (500-ms sliding window advanced in 50-ms steps; n = 78 ACC, 160 PLC, and 60 ILC units). Cyan, ACC; orange, PLC; purple, ILC. Filled circles, actual data; empty square, trial-shifted data (control). Light orange and light blue dashed lines, mean onset times (averaged across all sessions) of the reward and memory stages, respectively. Colored squares/bars on top, significant differences (permutation test, p < 0.05) between the original and trial-shuffled data. Inset, fractions of choice-coding neurons during the memory and reward stages (first 1 s each).

