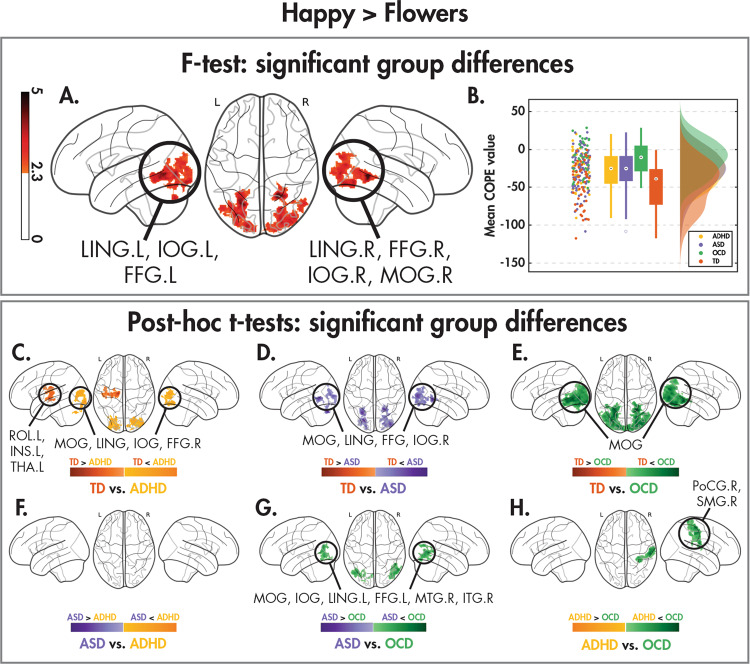
Fig. 1. Group differences to dynamic happy faces vs. flowers.
Significant (Z > 2.3, pcorr < 0.05) between-group differences in the happy > flowers contrast as revealed by one-tailed F test (A), the distribution of the effect across groups (B) along with the post hoc pairwise t tests (Z > 2.3, pcorr < 0.008) between the four diagnostic groups (C, D and E contrasts between the TDs and the three NDDs and F, G and H the contrasts between the NDDs).

