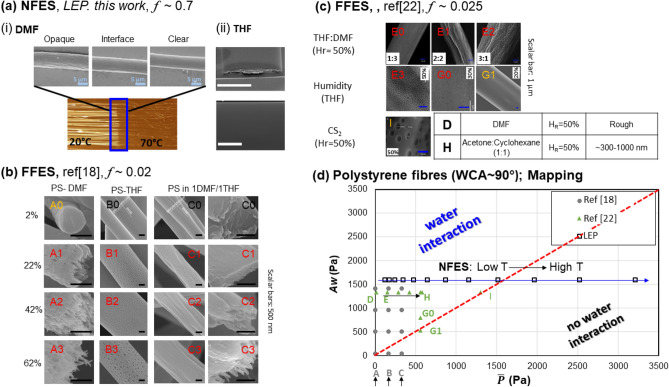
Figure 3.
(a) Images illustrating different surface microstructures of NFES polystyrene (PS) fibres fabricated from (i) a PS-DMF solution system, and (ii) a PS-THF solution system. (b) Microstructures of PS fibres recaptured from Lu et al.’s FFES work18 (Adapted with permission from American Chemical Society. Copyright 2013). (c) Microstructures of PS fibres recaptured from Megelski et al.’s FFES work20 (Adapted with permission from American Chemical Society. Copyright 2002). In (b and c), each microstructure is labelled with an identifier, and are classified into one of three categories: with black-coloured labels indicating a smooth fibre surface, red labels a porous/textured fibre surface, and yellow-coloured label a transition (boundary). (d) Mapping of the estimated Aw versus associated with different PS fibre fabrication conditions. Square symbols indicate values derived from conditions associated with NFES in (a); circular symbols from the FFES of (b); and triangular symbols from FFES of (c). WCA = water contact angle. (Note: The dotted red-line indicates the transition condition of . If we cross this line from to the left-hand-side to the right-hand-side, we will cross the water interaction area to no water interaction area).

