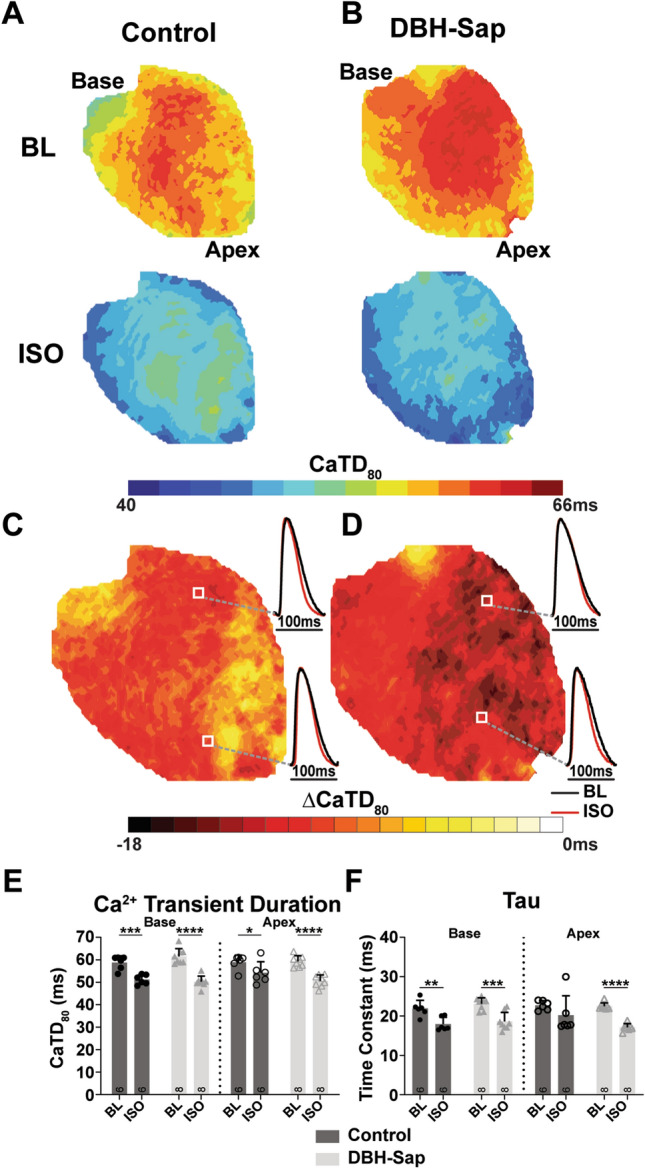
Figure 4.

Calcium transient duration (CaTD80) and tau in control and DBH-Sap hearts at baseline (BL) and with isoproterenol (ISO) stimulation at a pacing cycle length of 100 ms. (A,B) Example maps of CaTD80 at BL and with ISO in both groups. (C,D) Example maps and optical Ca2+ signals showing the difference in CaTD (ΔCaTD80) from BL with ISO stimulation. (E) Mean CaTD80 at BL and with ISO from base and apex regions of both groups. (F) Mean tau at BL and with ISO for both groups. Data are mean ± SD; analyzed with GraphPad Prism 8.3 (GraphPad Software, San Diego, CA, USA); control: n = 6; DBH-Sap: n = 8; *p < 0.05, **p < 0.01, ***p < 0.001, ****p < 0.0001.
