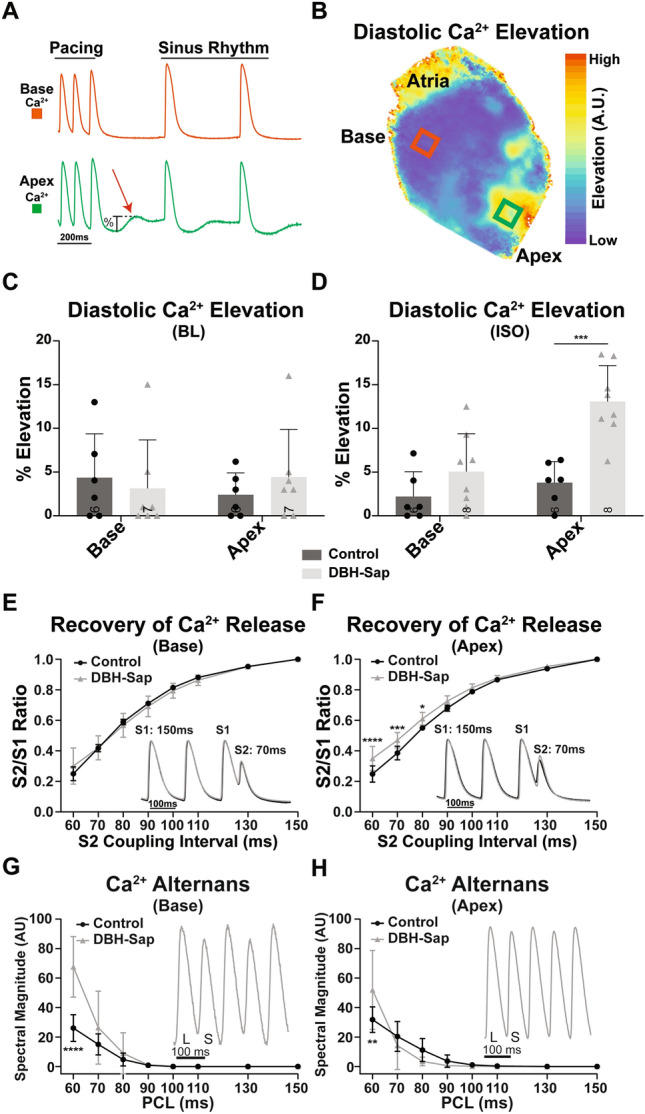
Figure 5.

(A) Example optical Ca2+ signals showing diastolic Ca2+ elevation primarily at the apex but not at the base of a DBH-Sap heart following cessation of rapid pacing (70 ms pacing cycle length, PCL). (B) Example optical map of relative diastolic Ca2+ elevation in a DBH-Sap heart immediately after cessation of pacing at a PCL of 70 ms. (C,D) Mean diastolic Ca2+ elevation at BL (C) and with ISO (D) from the base and apex regions of both group after a 70 ms pacing train. (E) Amplitude of recovery of Ca2+ release at the base with progressively shorter S2 coupling intervals. (F) Amplitude of recovery of Ca2+ release at the apex with progressively shorter S2 coupling intervals. There was a main effect of animal group (p < 0.0001 control vs. DBH-Sap) and differences at S2 = 60, 70, and 80 ms as indicated. (G) CaT alternans magnitude (L large; S small) between control and DBH-Sap hearts at the base. There was a main effect of animal group (p = 0.0002 control vs. DBH-Sap) and a difference at PCL = 60 ms as indicated. (H) CaT alternans magnitude at the apex. There was no main effect of animal group, but alternans magnitude was different at PCL = 60 ms. Data in (E–H) were analyzed by a two-way ANOVA (S2 coupling interval or PCL as one factor, animal group as the other factor) followed by Sidak’s multiple comparison post-testing. Data are mean ± SD; analyzed with GraphPad Prism 8.3 (GraphPad Software, San Diego, CA, USA); control: n = 5–6; DBH-Sap: n = 4–8; *p < 0.05, **p < 0.01, ***p < 0.001, ****p < 0.0001.
