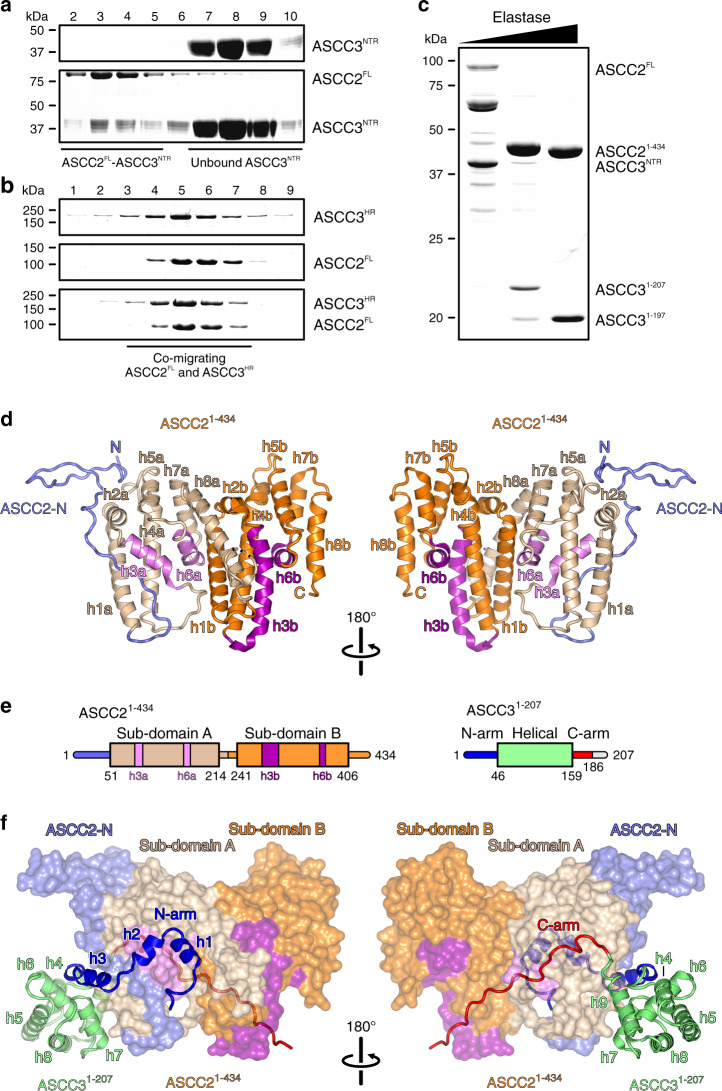
Fig. 1. Delineation of a minimal ASCC2–ASCC3 complex and structural overview.
a, b SDS-PAGE analysis of SEC runs monitoring interaction of ASCC2FL and ASCC3NTR (a) and lack of interaction between ASCC2FL and ASCC3HR (b). In this and following figures: kDa, molecular weights of molecular weight markers in kDa. c SDS-PAGE analysis of elastase treatment of the ASCC2FL-ASCC3NTR complex. Bands running between ASCC2FL and ASCC21–434 represent intermediate ASCC2 fragments that occur transiently in the course of the digestion. Experiments shown in a–c have been repeated independently at least three times with similar results. d Orthogonal cartoon plots of ASCC21–434. ASCC2-N, N-terminal extension, slate blue; helices in sub-domain A, beige and violet; helices in sub-domain B, orange and purple. Helices are labeled as in the text. N, N-terminus; C, C-terminus. e Schemes of the domain organizations of ASCC21–434 and ASCC31–207. Violet and purple bars in the ASCC21–434 scheme represent helices h3a/b and h6a/b. The C-terminal 21 residues of ASCC31–207 (gray line) are not defined in the electron density. f Orthogonal views on the ASCC21–434-ASCC31–207 complex, with ASCC21–434 as surface view and ASCC31–207 as cartoon. ASCC21–434, colored as in d. N-arm of ASCC31–207, blue; C-arm of ASCC31–207 complex, red; helical domain of ASCC31–207, lime green.

