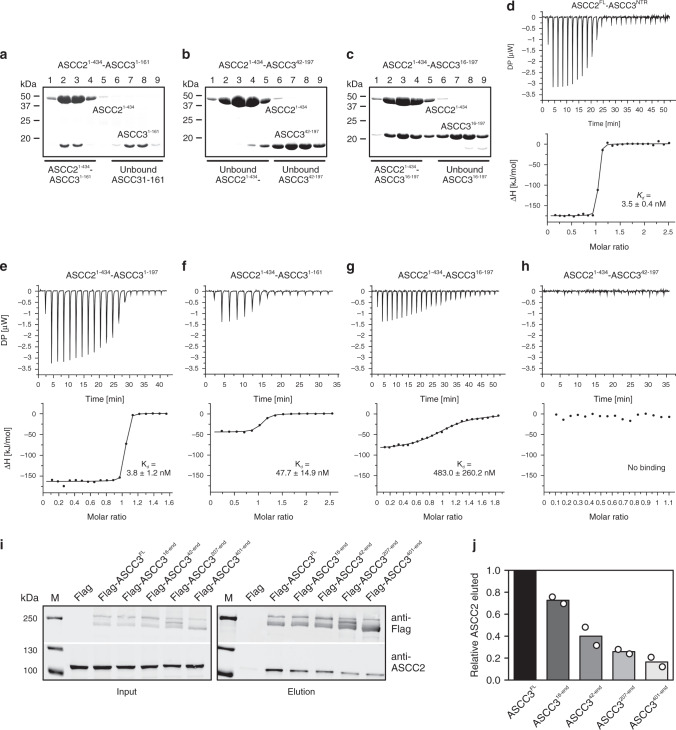
Fig. 3. Interaction analysis.
a–c SDS-PAGE analysis monitoring SEC runs of the indicated mixtures of proteins. d–h ITC runs monitoring the interaction between the indicated pairs of proteins. Deduced Kd values are listed as means ± SD for runs for which affinities could be quantified. i Western blot monitoring pulldown of ASCC2 by the indicated ASCC3 constructs from cell extracts. j Quantification of the data shown in i. Columns represent means relative to ASCC3FL of n = 2 independent experiments, using the same biochemical samples. Open circles, individual measurements.

