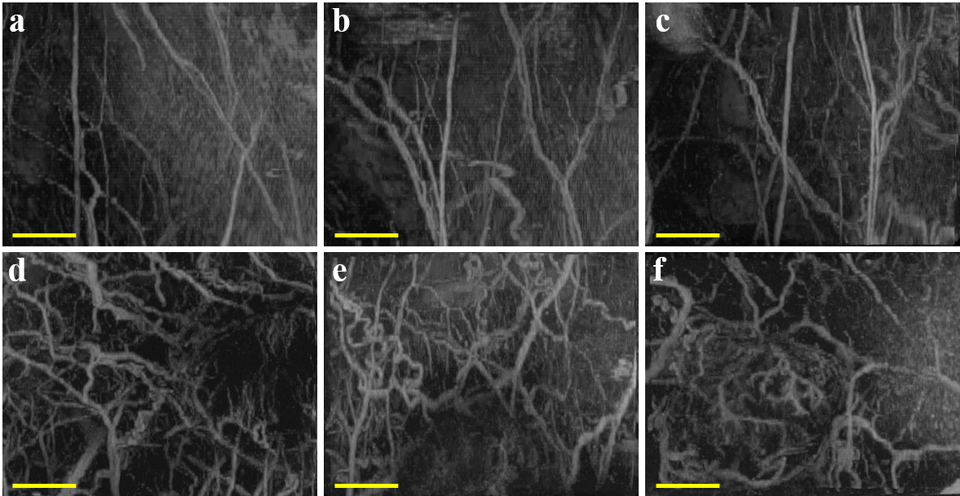
Figure 4:

Acoustic angiography maximum intensity projections showing microvasculature in healthy (a – c) or tumor-bearing (d – f) tissue in a subcutaneous rat fibrosarcoma model. Scale bar = 5 mm. Reprinted by permission from: Gessner RC, Aylward SR, and Dayton PA, Radiology, 2012;264:733–740, Radiological Society of North America.
