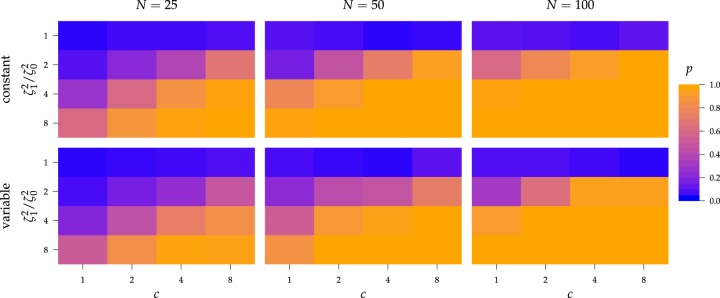
Figure 3.
The frequency with which  was
excluded from the
  CI when background rates were
constant (top row of panels) or variable (bottom row of panels). Each panel
corresponds to simulations for a given number of species,
  . Within each panel, rows correspond
to different degrees of state-dependent rate variation,
  , and columns
correspond to different numbers of continuous characters,
  . Each cell represents the fraction
of the
  CI that exclude
 , colored
according to the scale (at right).

