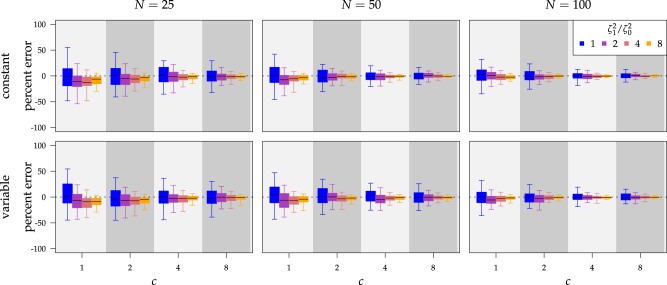
Figure 4.
The percent error of the posterior-mean estimates of  when background rates were
constant (top row of panels) or variable (bottom row of panels). Each column of
panels corresponds to simulations for a given number of species,
 . Within each panel, boxplots
depict the distribution of percent error across 100 simulated data sets for each of
the
  continuous characters (along the
x-axis), colored by the true state-dependent rates,
  (see inset
legend). Boxplots represent the middle
  (boxes) and
the middle
  (whiskers) of simulations.

