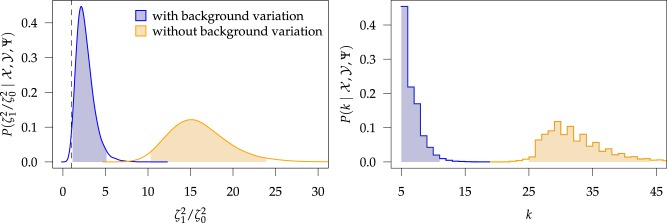
Figure 5.
At left, the posterior densities (curves) and the  CI (shaded regions) for the
state-dependent rate-ratio,
  , when the
background-rates are constant (orange), or when they vary among lineages (blue),
inferred for the haemulid data set. The dashed vertical line corresponds to
 . At
right, the posterior distribution (lines) and the
  CI (shaded regions) for the number
of habitat transitions,
  , assuming the
background-rates are constant (orange), or vary among lineages (blue).

