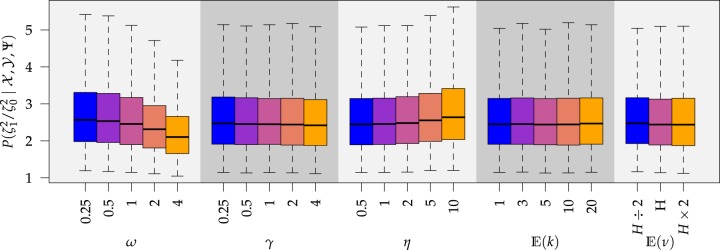
Figure 6.
The posterior densities of the state-dependent rate-ratio,
 , for the
haemulid data set under various priors. Each band of boxplots corresponds to a
different prior-sensitivity experiment. Within each band, boxplots represent the
 CI (box) and
 CI (whiskers) for the posterior
density under a particular value of that prior.

