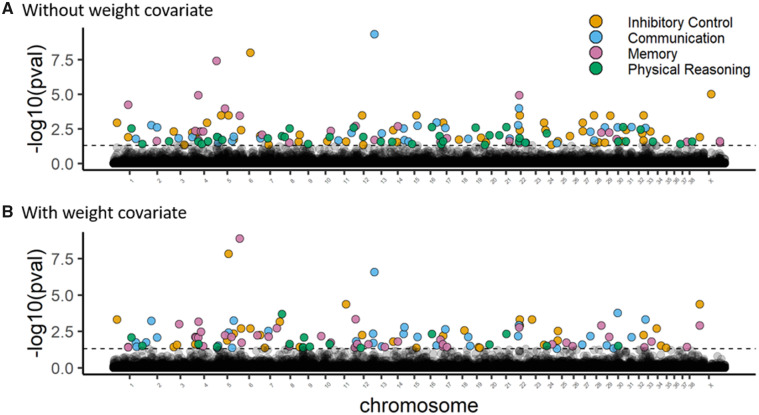
Fig. 3.
Manhattan plots showing gene-level associations with cognitive factors both (A) without covariates and (B) with breed-average body weight as a covariate. Gene-level associations were produced by aggregation of SNPs within each gene using Fisher’s method, corrected for linkage disequilibrium by Nyholt’s method. The dashed line represents the threshold for genome-wide significance after false discovery rate correction, and genes achieving genome-wide statistical significance are color-coded for the associated cognitive factor.

