
Figure 2.
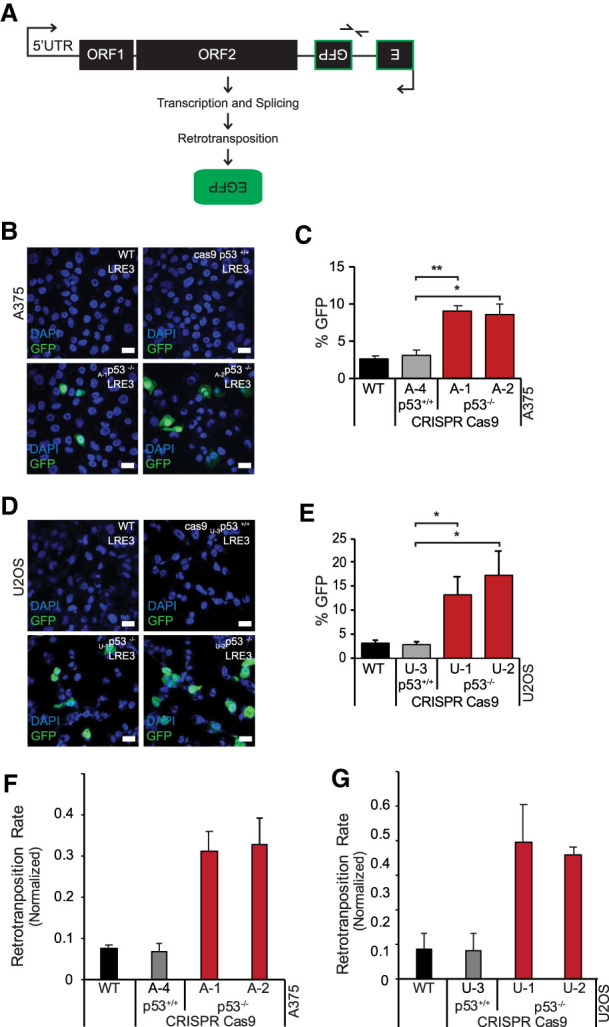
p53 loss is permissive for human L1 de novo retrotransposition. (A) Schematic depiction of the 99-gfp-LRE3 retrotransposition indicator. eGFP fluorescence indicates a complete retrotransposition cycle. Representative confocal images (obtained at 63×; scale bars, 20 μm) of GFP fluorescence in stable wild-type, cas9-treated control, and p53−/− A375 (B) and U2OS (D) 99-gfp-LRE3 integrant cell populations counterstained with DAPI. Quantification (n = 3) of the percentage of GFP-positive cells by flow cytometry for A375 (C) and U2OS (E) cells, error bars represent the standard error of the mean. (*) P-value ≤ 0.05, (**) P-value < 0.005. Droplet digital PCR (ddPCR) quantification (n = 2) of de novo LINE1 integration events in A375 (F) and U2OS (G) cells, normalized to single-copy gene puma abundance. Primer pair 2 (barbed arrows shown in A) specifically detects spliced GFP (indicating a complete retrotransposition life cycle) in genomic DNA. Bar graphs are averages of two biological replicates and error bars are the standard deviation.