Figure 5.
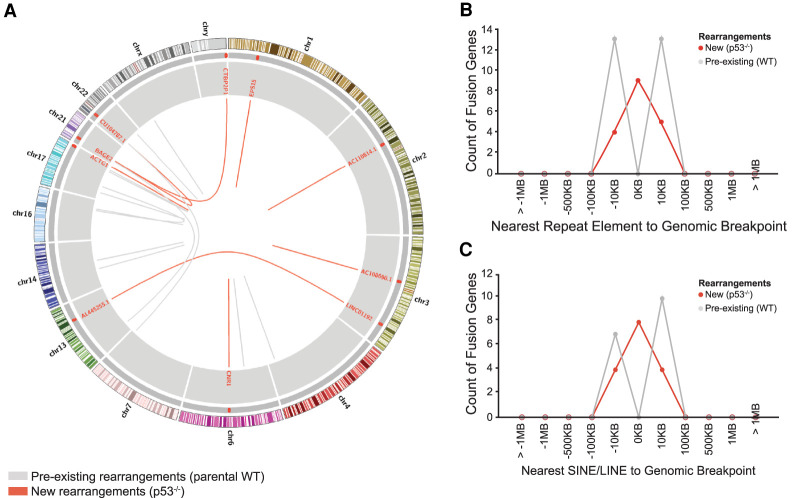
De novo rearrangements detected after p53 loss are associated with retroelements. (A) Circos plot of genomic rearrangements in A375 cells. Genomic rearrangements emerging after p53 loss are indicated (red lines) along with pre-existing rearrangements in the parental A375 cell line (gray lines). Repeat element proximity is indicated by red tiles (outer gray ring) along with annotations for rearrangement junctions (inner gray ring). (B) Genomic rearrangements occur at repeat elements in p53 knockout (n = 9 of 18 breakpoints) but not wild-type (n = 0 of 26 breakpoints) cells. (C) p53 knockout associated genomic rearrangements are commonly associated with LINE and SINE (n = 8 of 18 breakpoints), but not LTR or DNA repeat elements (n = 1 of 18 breakpoints).

