Figure 7.
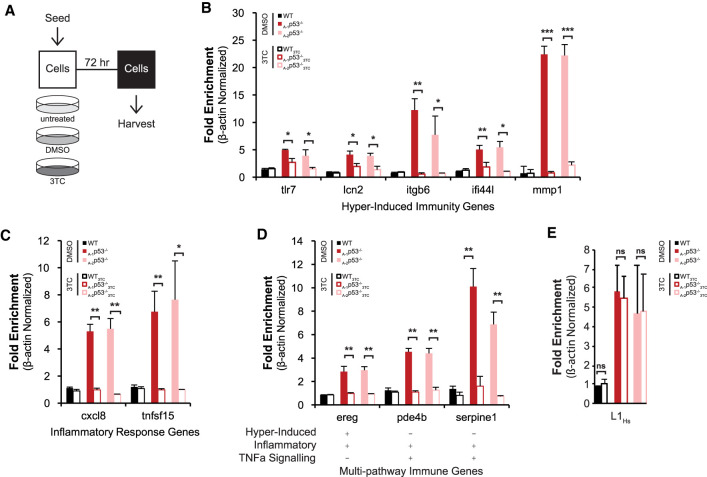
A LINE1 antagonist, 3TC, prevents the inflammatory program triggered by p53 loss (A) Schematic of the experimental workflow. Expression of selected immunity (B) and inflammation response (C) genes was quantified using RT-ddPCR. Likewise, targets with overlapping immune pathway designations (D) and 5′ intact L1Hs (E) were similarly analyzed by RT-ddPCR. Wild-type and two p53 knockout lines treated in parallel with vehicle, DMSO, only (filled bars) or 3TC (open bars). Transcript levels were normalized to β-actin and their fold change was calculated relative to their wild-type values (see Supplemental Fig. S6). For B–D, bar graphs plot the average of three biological replicates and error bars represent SEM. For Figure E, bar graphs represent the average of three biological replicates and error bars indicate the standard deviation. Two tailed t-tests were performed for all samples. (*) P-value < 0.05, (**) P-value < 0.005, (***) P-value < 0.0005, (ns) not significant. Note that treatment with the reverse transcriptase inhibitor, 3TC, prevented induction of immune and inflammatory gene sets but did not impact L1Hs RNAs.

