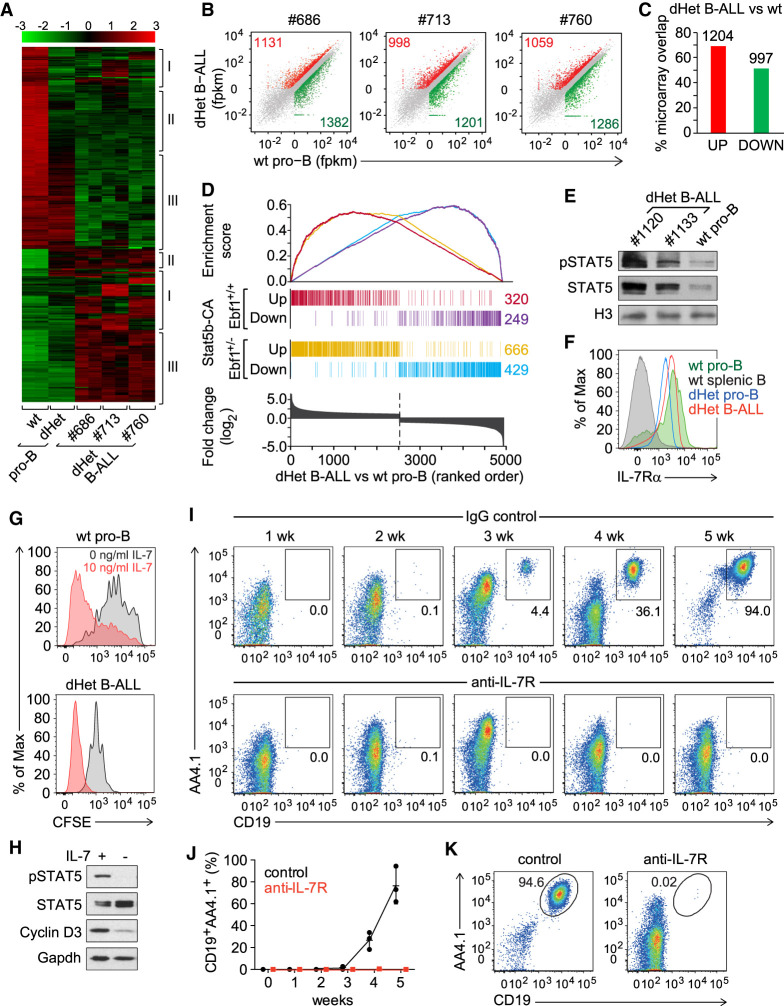
Figure 1.
IL7-STAT5 signaling drives leukemia development. (A) Transcriptional profiling of genes differentially expressed (more than fourfold) between wild-type (wt) pro-B, Ebf1+/− Pax5+/− (dHet) pro-B and dHet B-ALL cells. B-ALL cells were derived from three independent mice (ID #686, #713, and #760). The expression values of the microarray analysis are scaled to z-score (top). The clusters of genes showing clonal variations (I), preleukemic-specific (II) and leukemia-specific (III) differences of expression are indicated. (B) RNA-seq scatter plots depicting the relative gene expression in dHet B-ALL cells (Y-axis) of three mice (ID #686, #713, and #760) relative to wt pro-B cells (X-axis). All significantly twofold up-regulated (red), twofold down-regulated (green), and unaltered genes (gray) are highlighted. (C) Percentage overlap of significantly up-regulated (red) or down-regulated (green) genes as determined by the RNA-seq analysis to the twofold up-regulated or down-regulated genes as determined by the microarray analysis, respectively. The numbers above the bars indicate the number of dysregulated genes in both analyses. (D) Overlap of up-regulated and down-regulated genes in Stat5b-CAtg and Stat5b-CAtg Ebf1+/− leukemic cells with genes that are differentially expressed in Ebf1+/−Pax5+/− dHet B-ALL cells relative to wt pro-B cells. (Bottom) The differentially expressed genes are ranked according to the fold change difference between dHet B-ALL and wt cells. (E) Immunoblot analysis of phospho-STAT5 and total STAT5 in dHet B-ALL cells (n = 2; mouse ID #1120 and #1133) and sorted wild-type fraction B and C cells. Histone3 (H3) was used as a loading control. (F) Flow cytometric analysis of IL-7Rα expression in dHet B-ALL cells (red), dHet pro-B (blue), wt pro-B (green), and wt splenic CD19+ B cells (gray). Wild-type pro-B and splenic B cells served as positive and negative controls, respectively. (G) Flow cytometric analysis of CFSE staining in wt pro-B cells (top) and dHet B-ALL cells (bottom). Cells were labeled with 5mM CFSE and cultured in the absence (gray) or presence (red) of IL-7 at 10 ng/mL for 4 d. (H) Immunoblot analysis of phospho-STAT5, total STAT5, and Cyclin D3 in dHet B-ALL cells cultured in the presence (+) or the absence (−) of IL-7 for 1 d. Gapdh was used as a loading control. (I,J) Longitudinal flow cytometric analysis of donor-derived CD19+AA4.1hi dHet B-ALL cells in peripheral blood of Rag2−/− recipient mice, injected with 1 mg of anti-IL-7 receptor antibody or control rat IgG antibody. The antibodies were injected 1 and 3 d before and every second day after the adoptive transfer of 1 × 10⁵ CD19+AA4.1hi dHet B-ALL cells. The percentages of donor-derived dHet B-ALL cells in the peripheral blood were weekly determined up to 5 wk (n = 3). (K) Flow cytometry analysis of donor-derived CD19+AA4.1hi dHet B-ALL cells in the spleen of recipient mice, treated with control IgG or anti-IL7R antibody, at 5 wk after transplantation.

