Figure 2.
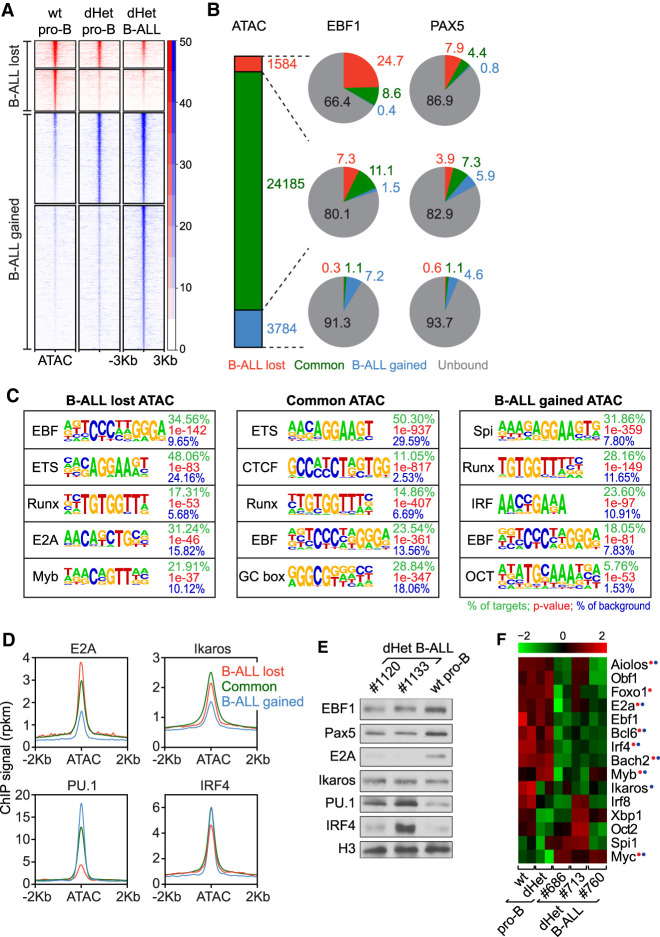
Changes in the transcriptional network of dHet B-ALL. (A) Heat map of ATAC signals ∼3 kb from the center of ATAC peaks that are lost (red) or gained (blue) in dHet B-ALL cells relative to wild-type pro-B cells. The clusters are further grouped based on the overlap with ATAC peaks in dHet pro-B cells. The data represent two biological replicates. The RPKM count value is scaled to the heat map signal intensity. (B) The percentage overlap of EBF1 (middle) and Pax5 (right) peaks to the ATAC peaks (left) is shown in the pie charts. The gained, common, and lost peaks in dHet B-ALL cells relative to wild type are highlighted in red, green, and blue, respectively. EBF1- or Pax5-unbound ATAC peaks are shown in gray. (C) Analysis of transcription factor-binding motifs at ATAC peaks. The top five motifs enriched in ATAC peaks that are lost (left), retained (middle), and gained (right) in B-ALL cells relative to wild-type pro-B cells are shown. The percentage of peaks having the motif, the P-value, and percentage detected in the background are indicated for each motif. (D) Distribution of previously published E2A, Ikaros, IRF4 and PU.1 ChIP signals in pro-B cells, ∼2 kb of the ATAC peak centers, in B-ALL lost (red), retained (green) and gained (blue) ATAC clusters. (E) Immunoblot analysis of EBF1, Pax5, E2A, Ikaros, PU.1, and IRF4 in dHet B-ALL cells (n = 2; mouse ID #1120 and #1133) and sorted wild-type pro-B cells. Histone 3 (H3) served as the loading control. (F) RNA-seq expression profiles of B lineage transcription factors in wt pro-B, dHet pro-B, and dHet B-ALL cells derived from three mice (mouse ID #686, #713, and #760). (Top) The FPKM expression values are scaled to the z-score. Genes having differential (B-ALL-gained or B-ALL-lost) EBF1 binding (red) and/or Pax5 binding (blue) are highlighted.

