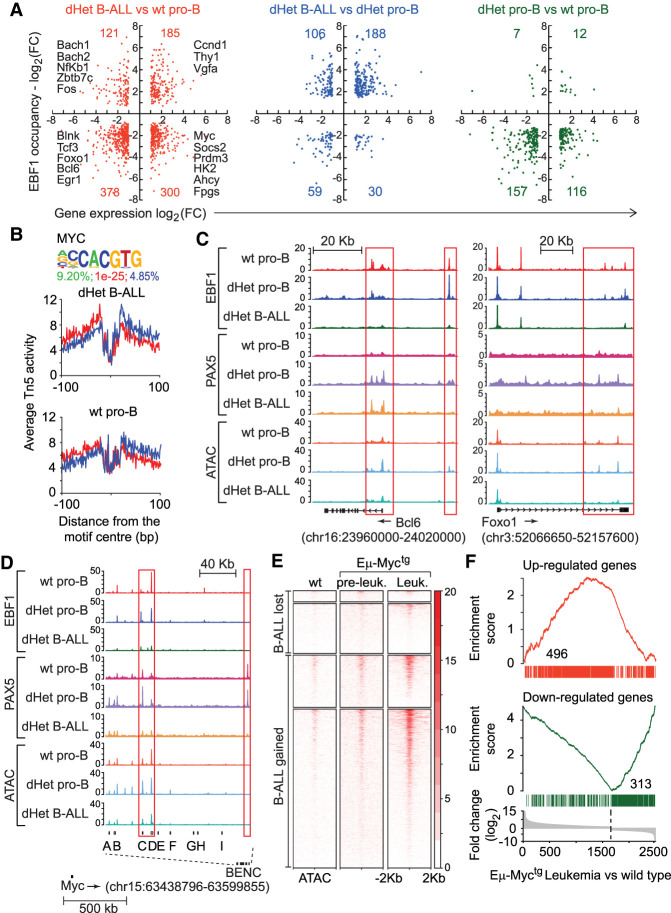
Figure 3.
The activation of Myc and its targets in dHet B-ALL. (A) Overlap of genes differentially expressed (X-axis) and differentially bound by EBF1 (Y-axis) in dHet B-ALL cells relative to wild-type pro-B cells (left), dHet B-ALL cells relative to dHet pro-B cells (middle), and dHet pro-B cells relative to wild-type pro-B cells (right). The key differentially regulated genes between dHet B-ALL and wt pro-B cells are highlighted. (B) The abundance of the Myc-binding motif in the B-ALL gained ATAC peaks (top) and digital genomic footprinting analysis showing normalized Tn5 insertion profiles, in dHet B-ALL and wt pro-B cells, around footprinted Myc motifs identified in dHet B-ALL cells (bottom). Insertions on the forward and reverse strands are indicated in red and blue, respectively. The percentage of peaks having the motif, the P-value, and percentage detected in the background are indicated. (C,D) Screenshots showing the distribution of EBF1 and Pax5 occupancy and chromatin accessibility, as determined by ChIP-seq and ATAC-seq analysis, on the Bcl6 gene (C, left), Foxo1 gene (C, right), and BENC regulatory elements of the Myc locus (D) in wt pro-B, dHet pro-B, and dHet B-ALL cells. The ChIP and ATAC signals are normalized to 10 million reads (Y-axis). (E) Heat map of Myc ChIP signals, from the wt, preleukemic (Eµ-Myctg), and leukemic cells (Eµ-Myctg), 2 kb around the center of dHet B-ALL-lost and B-ALL-gained ATAC peaks. (F) Overlap of genes up-regulated (top) or down-regulated (bottom) in dHet B-ALL cells to the genes differentially expressed in the Eµ-Myctg leukemic cells. The differentially expressed genes are ranked according to the fold change difference between Eµ-Myctg leukemic cells and wt cells.

