Figure 4.
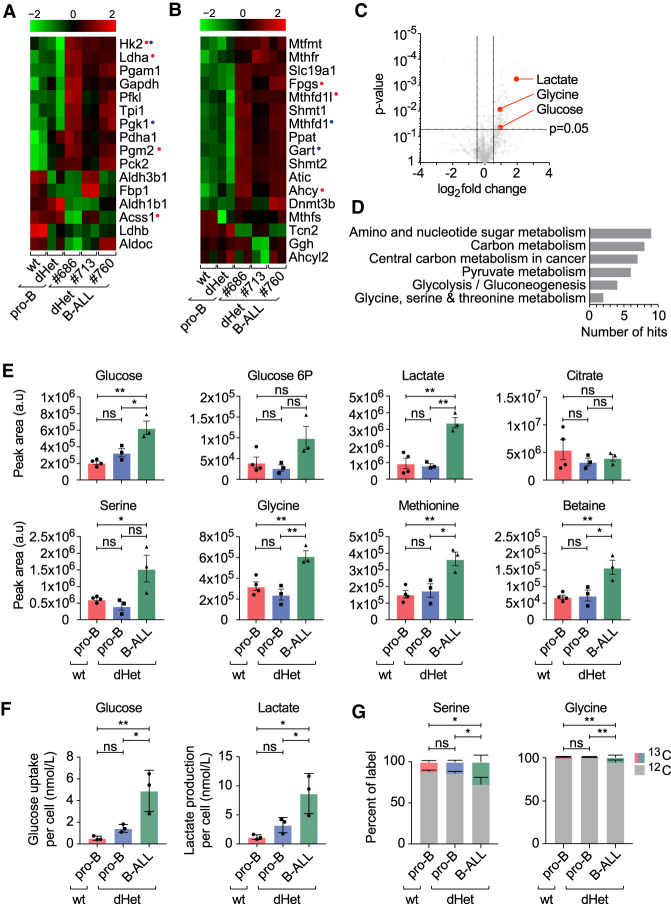
Changes in the metabolic pathways of dHet B-ALL. (A,B) RNA-seq expression profile of genes involved in glycolysis (A) and one-carbon metabolism (B) in wild-type (wt) pro-B, dHet pro-B, and dHet B-ALL cells. Data were derived from three mice (mouse ID #686, #713, and #760). (Top) The FPKM expression values are scaled to the z-score. Genes having differential (B-ALL gained or B-ALLlost) EBF1 binding (red) and Pax5 binding (blue) are highlighted. (C) Untargeted metabolic analysis (using XCMS) of polar metabolites extracted from 5 × 10⁶ wild-type pro-B, dHet pro-B, and dHet B-ALL cells that were cultured in the presence of IL-7. (D) Pathway analysis of significantly different metabolites using the KEGG pathway mapper tool. The total number of significantly different metabolites found in each pathway is indicated. (E) Targeted analysis of metabolic pathways of interest identified in D. Histograms compare metabolites in glycolysis (glucose, glucose-6P, and lactate) and one-carbon metabolism (serine, glycine, methionine, and betaine) extracted from 5 × 10⁶ wt pro-B (red), dHet pro-B (blue), and dHet B-ALL (green) cells. (F) Glucose uptake (left) and lactate release (right) of 0.4 × 10⁶ wt pro-B, dHet pro-B and dHet B-ALL cells cultured for 24 h. (G) 13C-glucose tracing analysis depicting the relative levels of 13C and 12C serine (left) and glycine (right) in 2 × 10⁶ wt pro-B, dHet pro-B and dHet B-ALL cells cultured with 13C-glucose for 10 min.

