Figure 6.
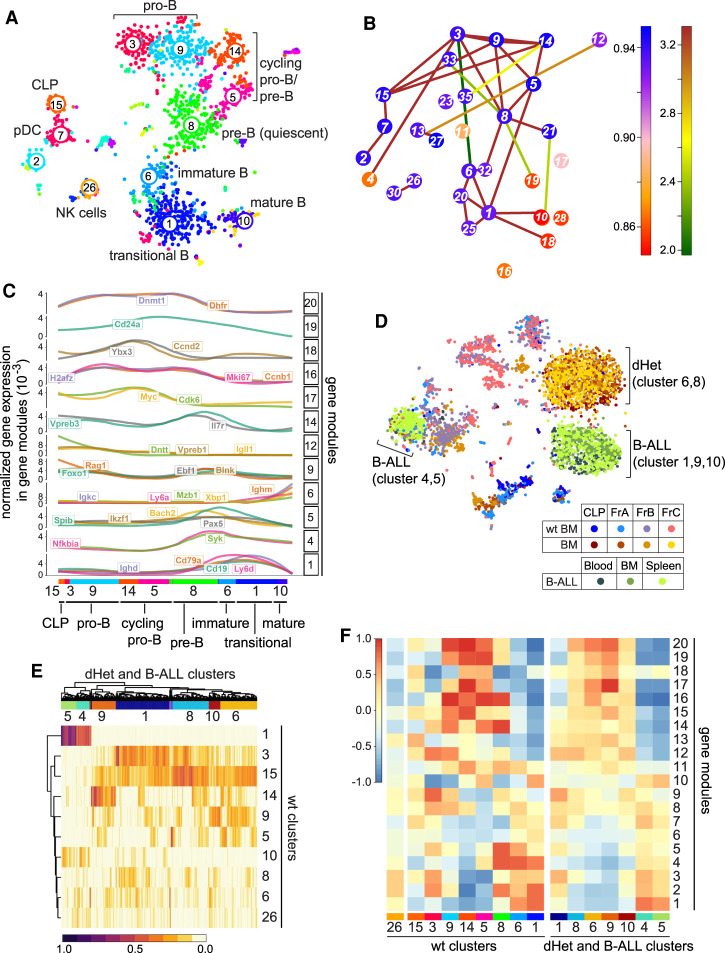
Leukemic cells of Ebf1+/−Pax5+/− mice have mixed signatures of early pro-B cells. (A) t-SNE plot representation of the single-cell RNA-seq analysis of wild-type bone marrow B cells. Each dot represents a cell. The numbers and different colors represent clusters of similar cells defined by the RaceID algorithm. The clusters are assigned to different developmental stages or cell types based on the gene expression profile. (B) Graphic representation of the lineage inference using StemID. The colors of the connections depict the −log10 P-value and the colors of the nodes indicate Δ-entropy of the cluster with the corresponding number. (C) Pseudotemporal ordering of gene expression changes along a putative differentiation trajectory of clusters 15, 3, 9, 14, 5, 8, 6, 1, and 10 as inferred in B. Genes are grouped into modules (left Y-axis) with similar expression profiles using self-organizing maps. Selected gene expression profiles along the differentiation trajectory are shown. Gene expression for every gene is normalized to total gene expression. (D) t-SNE map representing the clustering of cells in fractions A, B, and C and CLP sorting gates from wild-type and dHet bone marrow cells as well as from dHet B-ALL cells that were derived from blood, bone marrow, and spleen. The cells were clustered using RaceID. The cells from different sorting gates and their phenotypes are color-coded and indicated in the key. (E) Heat map representing the clustering of leukemic cells (columns) to wt cluster medoids (rows) using quadratic programming. The color-coded scale represents the weights from 0 to 1, which indicate the similarities of leukemic cells toward the wt cluster medoids. (Top) The hierarchical clustering of the weights yielded seven major leukemic clusters. (F) Heat map representing the aggregated expression values of genes defining 20 modules (rows) in each wt cluster (left X-axis) and dHet cluster (right X-axis). The aggregated expression value of each module is scaled as a z-score between 1 and −1.

