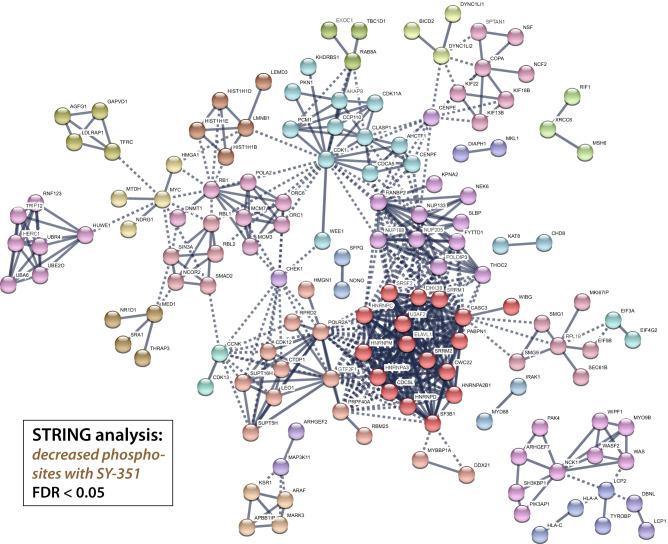
Figure 3.
Protein–protein interaction network of phosphoproteins with significantly decreasing phosphorylation sites upon SY-351 treatment. Proteins with decreasing phosphorylation sites (log2FC < 0 and FDR < 0.05) were visualized using the STRING database web application, and clustered using the MCL algorithm, with clusters indicated by node color.

