Figure 2.
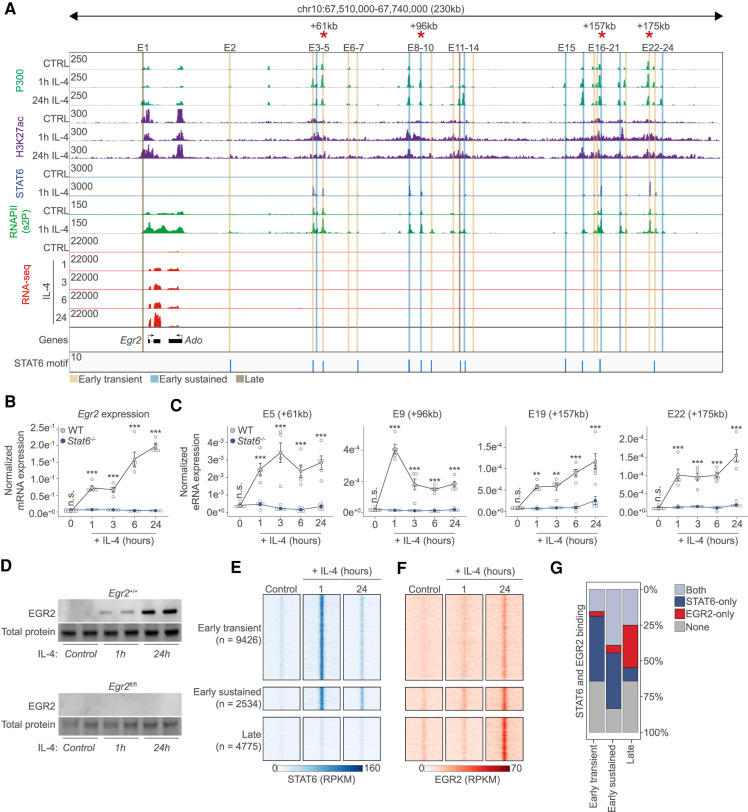
The transcription factor EGR2 is a direct STAT6 target. (A) Genome browser view on the Egr2 locus. ChIP-seq results for P300, H3K27ac, STAT6, and RNAPII (s2P [2-phosphoserine form]) is shown in control (CTRL) and IL-4 polarized macrophages. RNA-seq results are also shown on the indicated IL-4 time course. Putative enhancers are highlighted (E1–E24) and their genome activity pattern is indicated as determined in Figure 1. Red asterisks indicate enhancers for which enhancer RNA levels are measured in C. (B) RT-qPCR measurements of the Egr2 mRNA levels on the indicated time course from wild-type (WT) and Stat6−/− macrophages. The level of mRNA is normalized to the expression of Ppia. Experiments were repeated five times, and significant changes between groups were calculated by two-way analysis of variance (ANOVA). (C) RT-qPCR measurements of enhancer RNA levels on four distant enhancers over the indicated time course from WT and Stat6−/− macrophages. Experiments were repeated five times and significant changes between groups were calculated by two-way analysis of variance (ANOVA). (D) Western blot of EGR2 expression in wild-type and Egr2fl/fl macrophages in the presence or absence of IL-4. Experiments were repeated four times. One representative blot is shown with duplicate samples. Total protein serves as a loading control. (E) Read distribution plot of STAT6 binding in the three induced genome activity pattern groups in control and IL-4 polarized macrophage for the indicated periods of time in a 2 kb window around the P300 summits. RPKM (reads per kilobase per million mapped reads) values are plotted. (F), Read distribution plot of EGR2 binding in the three induced genome activity pattern groups in control and IL-4 polarized macrophage for the indicated periods of time in a 2-kb window around the P300 summits. RPKM (reads per kilobase per million mapped reads) values are plotted. (G) Stacked bar plot representation of the cobinding properties of STAT6 and EGR2 in the three regulatory element groups showing induced genome activity patterns.

