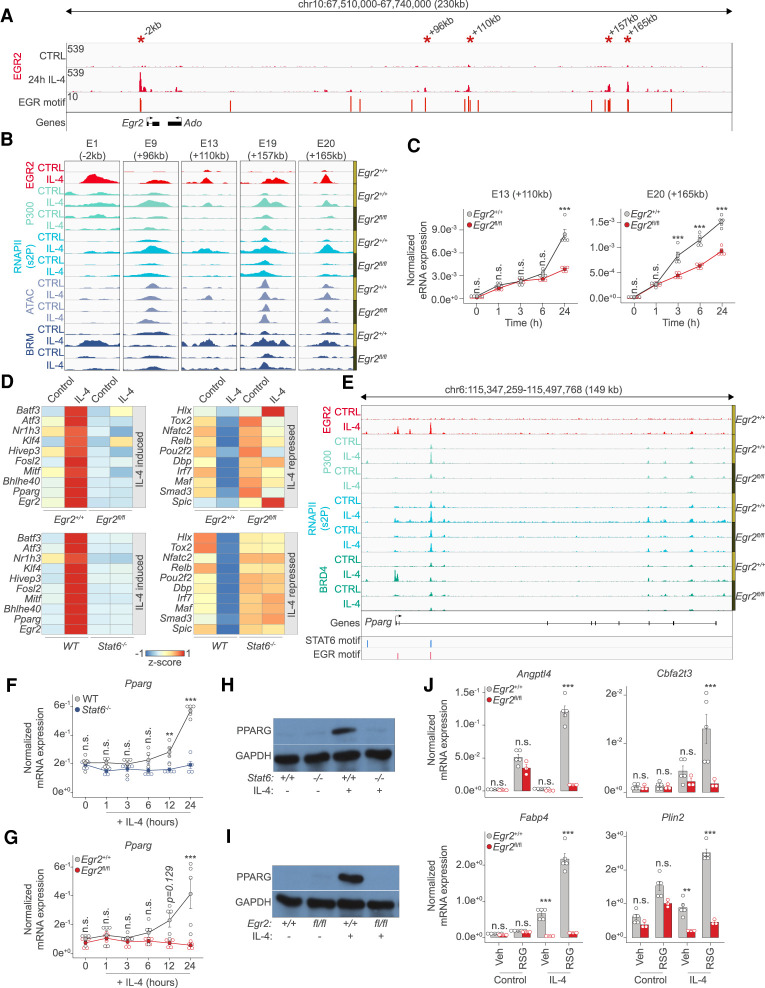
Figure 6.
The IL-4/STAT6/EGR2 axis controls the transcription factor cascade of alternative macrophage polarization. (A) Genome browser view on the Egr2 locus. Shown are EGR2 ChIP-seq results in unstimulated (CTRL) and IL-4 polarized macrophages. Motif scores of the EGR motifs overlapping with putative enhancer elements are indicated. Asterisks indicate EGR2 bound regions magnified in B. (B) Genome browser images on the enhancer regions highlighted in A. Shown are ChIP-seq results for EGR2, P300, RNAPII(s2P), and BRM in Egr2+/+ and Egr2fl/fl macrophages in the absence (control) and presence of IL-4 (24 h). ATAC-seq results in the same conditions are also shown. (C) Enhancer RNA expression detected by RT-qPCR on the indicated loci. The level of eRNA is normalized to the expression of Ppia. Experiments were repeated five times, and significant changes between groups were calculated by two-way analysis of variance (ANOVA). (D) Heat map representation of IL-4 altered (induced and repressed), Egr2-dependent (top) and Stat6-dependent (bottom) transcription factor gene expression. IL-4-induced (left) and IL-4-repressed (right) gene expression is visualized in the two genotypes. (E) Genome browser view on the Pparg gene locus. ChIP-seq data for EGR2 in wild type macrophages (Egr2+/+) and P300, RNAPII(s2P) and BRD4 in both Egr2+/+ and Egr2fl/fl macrophages are shown. Polarized (24 h of IL-4 treatment) and control conditions are depicted for each track. Regulatory regions with STAT6 and EGR motifs are highlighted. (F) RT-qPCR measurements of Pparg mRNA levels in wild-type (WT) and Stat6−/− control and IL-4 polarized macrophages over the indicated time course. The level of mRNA is normalized to the expression of Ppia. Experiments were repeated five times, and significant changes between groups were calculated by two-way analysis of variance (ANOVA). (G) RT-qPCR measurements of Pparg mRNA levels in Egr2+/+ and Egr2fl/f control and IL-4 polarized macrophages over the indicated time course. The level of mRNA is normalized to the expression of Ppia. Experiments were repeated five times, and significant changes between groups were calculated by two-way analysis of variance (ANOVA). (H) Western blot of PPARG expression in wild-type (Stat6+/+) and Stat6−/− macrophages in the presence or absence of IL-4. Experiments were repeated four times. One representative blot is shown. GAPDH serves as a loading control. (I) Western blot of PPARG expression in Egr2+/+ and Egr2fl/f macrophages in the presence or absence of IL-4. Experiments were repeated four times. One representative blot is shown. GAPDH serves as a loading control. (J) RT-qPCR measurements of Angptl4, Cbfa2t3, Fabp4, and Plin2 mRNA levels in Egr2+/+ and Egr2fl/fl control and IL-4 polarized macrophages exposed to either solvent control (vehicle) or rosiglitazone (RSG). The level of mRNA is normalized to the expression of Ppia. Experiments were repeated five times, and significant changes between groups were calculated by, two-way analysis of variance (ANOVA).

