Figure 7.
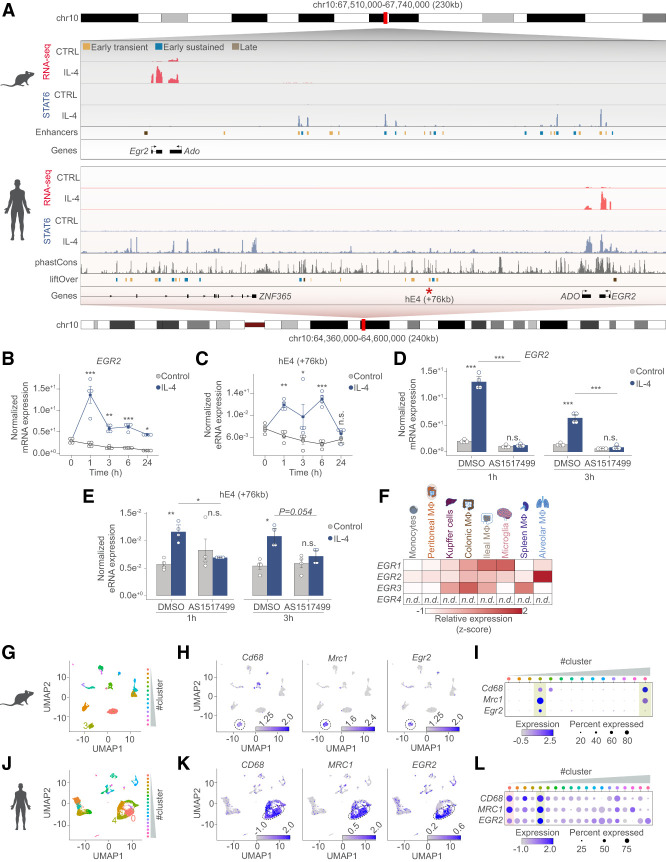
The IL-4/STAT6 signaling axis regulates EGR2 expression in human monocytes and EGR2 expression marks lung-resident macrophage subsets. (A) Genome browser views on the Egr2 loci in mouse and human macrophages. Shown are RNA-seq and STAT6 ChIP-seq results from the two species. Annotated enhancers are highlighted and color-coded according to their activity patterns. Conservation scores of the Egr2 locus is presented in the phastCons track followed by the liftOver track that shows the annotation of the conserved mouse enhancer regions to the human genome. The enhancer located +76 kb from the human EGR2 gene is marked with an asterisk because it is conserved between the two species and binds STAT6 as well. (B) RT-qPCR measurements of EGR2 mRNA levels in control and IL-4 polarized human differentiating macrophages over the indicated time course. The level of mRNA is normalized to the expression of PPIA. Experiments were repeated four times, and significant changes between groups were calculated by two-way analysis of variance (ANOVA). (C) RT-qPCR measurements of the synthesized enhancer RNA levels from the conserved enhancer located +76 kb from the human EGR2 gene. The level of eRNA from control and IL-4 polarized human differentiating macrophages over the indicated time course is shown, normalized to the expression of PPIA. Experiments were repeated four times, and significant changes between groups were calculated by two-way analysis of variance (ANOVA). (D) RT-qPCR measurements of EGR2 mRNA levels in control and IL-4 polarized human differentiating macrophages in the presence or absence (DMSO [dimethyl sulfoxide as vehicle control]) of the STAT6 inhibitor (AS1517499) at the two indicated time points. The level of mRNA is normalized to the expression of PPIA. Experiments were repeated four times, and significant changes between groups were calculated by two-way analysis of variance (ANOVA). (E) RT-qPCR measurements of enhancer RNA levels, synthesized from the +76-kb enhancer in control and IL-4 polarized human differentiating macrophages. Experiments were performed in the presence or absence (DMSO [dimethyl sulfoxide as vehicle control]) of the STAT6 inhibitor (AS1517499) at the two indicated time points. The level of eRNA is normalized to the expression of PPIA. Experiments were repeated four times, and significant changes between groups were calculated by two-way analysis of variance (ANOVA). (F) Heat map representation of the mRNA expression levels (RNA-seq GSE63340) of the EGR TF family members in the indicated cell types. Egr4 transcript was not detected (n.d.) in any of the cell types. (G) UMAP depicting the different cell clusters of the mouse lung defined by single cell RNA-seq (GSE133747). Cluster 3 is highlighted, which corresponds to the macrophage cluster having high Cd68 and Mrc1 expression. (H) Feature plots depicting the expression of Cd68, Mrc1, and Egr2 expression in the mouse data set. Cluster 3 is encircled to highlight the macrophage population. Log normalized expression values are plotted. (I) Dot plot representation of the average expression and percentage wise expression of Cd68, Mrc1, and Egr2 in the different cell clusters of the mouse data set. (J) UMAP depicting the different cell clusters of the human lung defined by single cell RNA-seq (GSE128033). Clusters 0 and 4 are highlighted, which corresponds to the macrophage clusters having high CD68 and MRC1 expression. (K) Feature plots depicting the expression of CD68, MRC1, and EGR2 expression in the human data set. Clusters 0 and 4 are encircled to highlight the macrophage populations. Log normalized expression values are plotted. (L) Dot plot representation of the average expression and percentage wise expression of CD68, MRC1, and EGR2 in the different cell clusters of the human data set.

