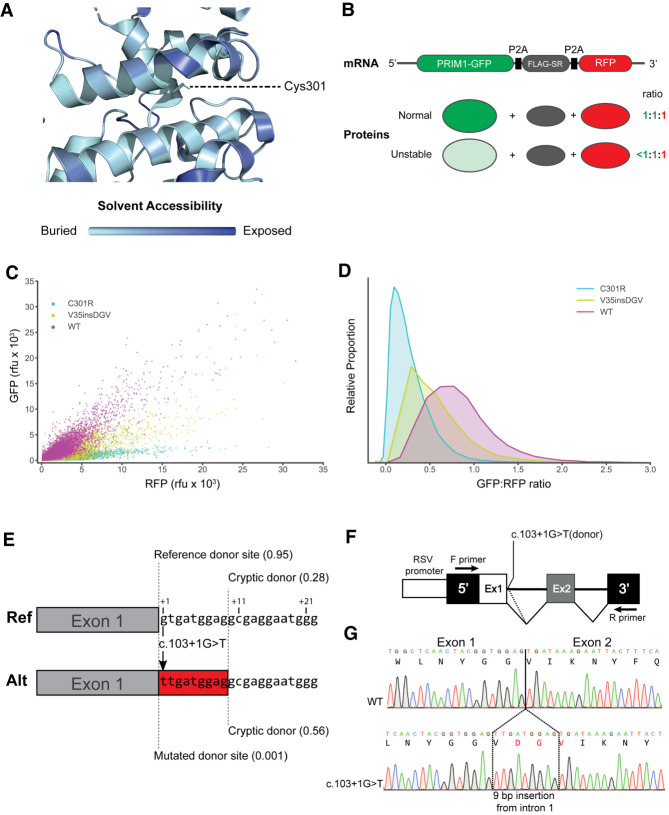
Figure 3.
The c.103+1G>T and C301R variants reduce PRIM1 protein levels. (A) Cysteine 301, substituted to arginine in P5, lies in a buried hydrophobic region. DNA primase dimer crystal structure (PDB: 4BPU) with residues shaded according to solvent accessibility. (B) Schematic of the FACS-based dual-reporter stability assay. Expression vector expresses an mRNA encoding PRIM1-GFP-P2A-FLAG-SR-P2A-RFP. Intervening P2A “self-cleaving” peptide sequences produce PRIM1-EGFP, FLAG-SR, and RFP polypeptides in equimolar amounts. PRIM1-GFP (wild type and mutants) and RFP levels are assayed in individual cells by flow cytometry. PRIM1-GFP and FLAG-SR levels can be independently assessed by immunoblotting (see Supplemental Fig. S3D). (C) GFP-RFP scatter plot for wild-type, C301R, and V35insDGV dual reporter constructs. n = WT, 27,027; C301R, 44,863; V35insDGV 46,441 cells respectively. (rfu) Relative fluorescence units. (D) Kernel density estimation plot of GFP:RFP ratios from C. (E) Schematic depicting the consequence of the c.103+1G>T variant on splicing. Reference and alternate sequences of intron 1 are shown with positions of the reference and cryptic splice donor sites marked by dotted lines. SpliceAI scores for splice donor sites in brackets. (Red box) Nine nucleotides of intron 6 included as a result of activation of the cryptic splice donor variant. (F) Schematic assaying the effect of the c.103+1G>T variant. Minigene assay. DNA spanning exon 1 (Ex1) and exon 2 (Ex2) of PRIM1 was cloned into the minigene. (Arrows) Position of PCR primers, (dotted line) splicing from cryptic splice donor. (G) Representative cDNA Sanger sequence traces from wild-type (WT) and c.103+1G>T variant minigene constructs. The three-amino-acid (DGV) insertion from the c.103+1G>T variant marked in red.

