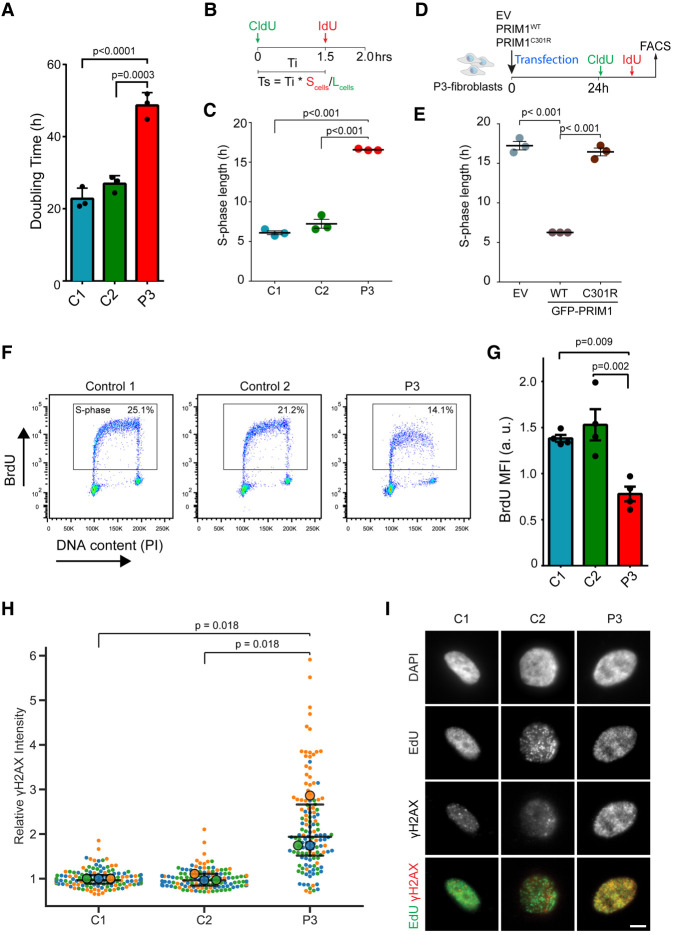
Figure 4.
Reduced cell proliferation and impaired DNA replication in PRIM1-deficient primary fibroblasts. (A) Cell doubling time plotted for three independent experiments on P3 and two unrelated control C1 and C2 primary fibroblast cell lines. Bars indicate the mean. Error bars indicate SD. (B) Schematic of CldU/IdU double-pulse experiment used to determine S-phase time. Cells were labeled with CldU at t = 0, followed by IdU after 1.5 h. Cells leaving S phase (Lcells) are labeled with CldU only, while cells remaining in S phase (Scells) are labeled with both CldU and IdU. (Ts) S-phase length, the product of interval between pulses (Ti) and the proportion of Scells to Lcells (Martynoga et al. 2005). (C) S-phase time is substantially increased in P3 fibroblasts compared with controls. Mean ± SEM, N = 3 experiments. (D) Schematic of rescue experiment. P3 fibroblast transfected with either empty vector (EV), wild-type (WT) or C301R-PRIM1-GFP as indicated and after 24 h S-phase time determined as in B for GFP + ve cells. (E) Complementation with WT PRIM1-GFP rescues slow S-phase progression in P3 fibroblasts. S-phase length plotted for n = 3 experiments. Mean ± SEM. (F) DNA content and BrdU flow cytometry scatter plots, representative of four independent experiments on control (C1 and C2) and P3 primary fibroblast cell lines. (G) BrdU incorporation is reduced in PRIM1-deficient cells during S-phase. Quantification of BrdU mean fluorescence intensity (MFI) from control and patient-derived fibroblasts according to S-phase gate in F. (a.u.) Arbitrary units. (H) γ-H2AX is increased in S-phase P3 fibroblasts. Mean γ-H2AX intensity calculated for EdU-positive nuclei from C1, C2, and P3 cells. n = 3 experiments. Data points are colored by experiment. (Filled circles) Mean values for each replicate, (bars) median and interquartile range (all values). Values were normalized for each experiment relative to C1 mean value. (P-values) Repeat measures ANOVA with Tukey multiple comparison test. (I) Representative immunofluorescence images of S-phase nuclei quantified in H. Scale bar, 5 µm. Statistics in A, C, E, and G are one-way ANOVA with Tukey multiple comparison test.

