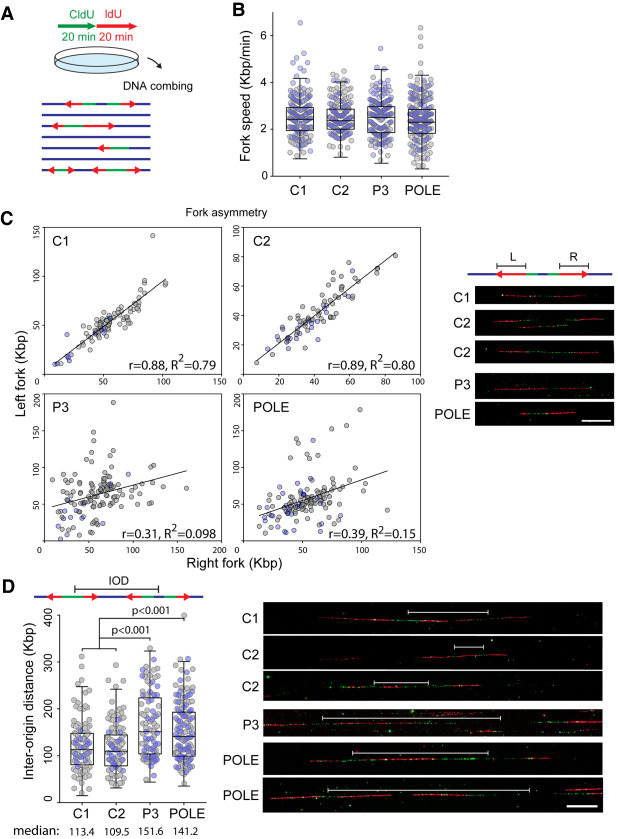
Figure 5.
PRIM1 deficiency causes fork asymmetry and increased interorigin distances, consistent with replication fork stalling and decreased replication initiation. (A) Schematic depicting DNA combing experiments. Sequential 20 min CldU and IdU pulses were performed on cultured primary fibroblasts, which were then harvested, with DNA combing performed to characterize DNA replication at the single-molecule level. (B) DNA fork speed, kilobases per minute, in primary fibroblasts from two unrelated control individuals (C1 and C2), a PRIM1-deficient individual (P3), and a POLE-deficient individual. (B–D) Gray and blue dots represent measurements from n = 2 respective independent experiments. (C) PRIM1-deficient cells exhibit fork asymmetry, similar to POLE-deficient cells. Left (L) versus right (R) fork ratio scatter plots. (r) Pearson correlation coefficient. (Right) Representative images of bidirectional forks. Scale bar, 20 µm. (D) Interorigin distance (IOD) in control, PRIM1-deficient, and POLE-deficient primary fibroblasts; box plots were graphed according to Tukey method (B,D). P-values, Kruskal–Wallis test. (Right) Representative images of IODs. Scale bar, 20 µm.

