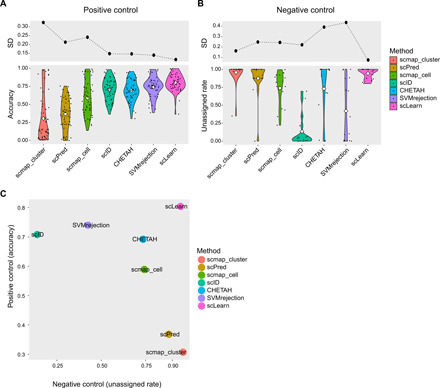
Fig. 3. Benchmark of scLearn with available methods for positive control scenario and negative control scenario.

(A) Benchmark in the positive control scenario. The white diamond line represents the mean value. (B) Benchmark in the negative control scenario. The white diamond line represents the mean value. (C) A comprehensive benchmark by integrating the test results from positive control scenario and negative control scenario.
