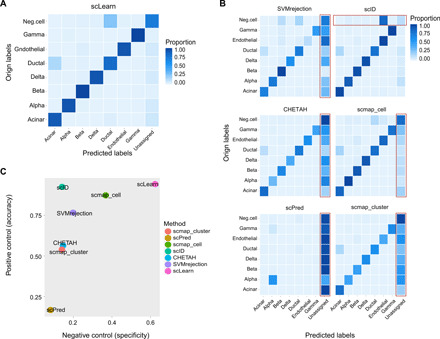
Fig. 4. The test in real application scenario.

(A) The prediction performance heatmap of confusion matrix for scLearn, with normalization for each row (Orign labels). Neg.cell, negative control cells, including activated stellate cells, epsilon cells, macrophage cells, mast cells, quiescent stellate cells, Schwann cells, and T cells. (B) Prediction performance heatmaps of confusion matrix for the other six methods, including SVMrejection, scID, CHETAH, scmap_cell, scPred, and scmap_cluster, with normalization for each row (Orign labels). The poor prediction results are outlined in the red box. (C) The comprehensive comparison by considering accuracy and specificity simultaneously. The specificity is defined as the proportion of correctly predicted unassigned cells among all predicted unassigned cells.
