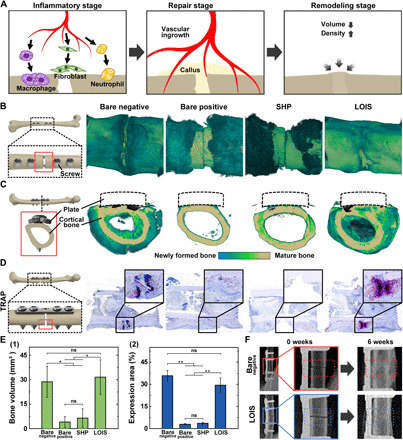
Fig. 6. Analysis of the bone healing process based on micro-CT scan images and TRAP staining.

(A) Schematics of the bone healing process after fracture. (B) Difference in the degrees of callus formation and (C) cross-sectional images of the fracture site for each surface group. (D) TRAP staining to visualize osteoclast activity and bone resorption. Quantitative analysis of the callus formation outside of the cortical bone with (E) (1) micro-CT and (2) osteoclast activity based on TRAP activity. (F) X-ray images of the fractured bone of bare negative (highlighted with red dotted rectangle) and LOIS (highlighted with blue dotted rectangle) after 6 weeks of implantation. Statistical analysis was performed via one-way analysis of variance (ANOVA). *P < 0.05. **P < 0.01.
