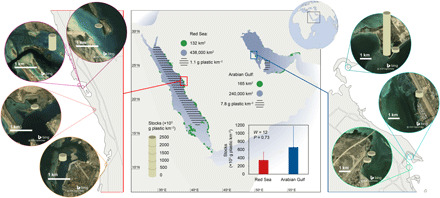
Fig. 1. Plastic stocks in mangrove sediments.

Plastic stocks (in grams of plastic per square kilometer accumulated since 1930) in each of the nine cores sampled in seven mangrove forests of Saudi Arabia (four on the Red Sea coast, framed in red, and three on the Arabian Gulf coast, framed in blue). The sand-colored cylinders on the aerial images indicate the core sampling point in the mangrove forests and the plastic stocks. The bar graph shows the means ± SE of the plastic stocks in the mangrove cores from the Red Sea (in red) and the Arabian Gulf (in blue), which are not significantly different between the two basins (Wilcoxon rank sum test; W = 12 and P = 0.73). The map reports, in green, the area of mangrove forests in the Red Sea (35) and in the Arabian Gulf (36); in blue, the extension of Red Sea waters and Arabian Gulf waters; and in a striped pattern, the areas where the concentration of plastics in surface waters has been assessed for the Saudi Red Sea (30) and Qatari Arabian Gulf (31) waters. Aerial images were printed from Bing Maps (Microsoft product screenshots reprinted with permission from Microsoft Corporation).
