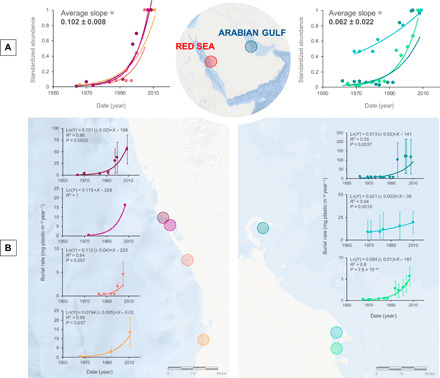
Fig. 2. Plastic burial rates in mangrove sediments since the 1950s.

Historical increases in (A) standardized (to the maximum burial rate of each site) plastic burial rates in Red Sea and Arabian Gulf mangrove sites and in each (B) of the four Red Sea and three Arabian Gulf studied mangrove sites, from the 1950s to date (see details in data S1 and in Materials and Methods). Solid lines represent the exponential fit, for which the fitted equation including the SE of the slope, R2, and P value are reported.
