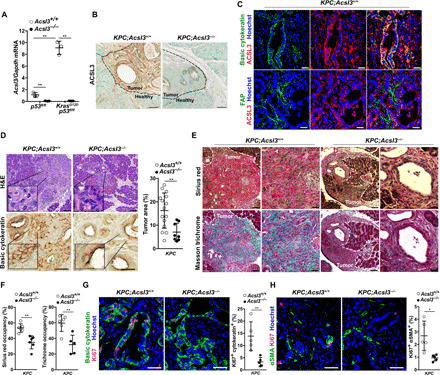
Fig. 2. Acsl3 knockout reduces tumor fibrosis and suppresses tumor progression.

(A) Acsl3 mRNA levels from healthy tissue (Kras+/+;p53flox/flox) either Acsl3+/+ or Acsl3−/− and dissected tumors from LSL-KrasG12D/+;p53flox/flox;Pdx1-CreERT2;Acsl3+/+ (KPC;Acsl3+/+) and KrasG12D/+;p53flox/flox;Pdx1-CreERT2;Acsl3−/− (KPC;Acsl3−/−) (n = 3 mice per group). (B) Representative IHC staining images of ACSL3 from KPC;Acsl3+/+ and KPC;Acsl3−/− pancreas sections representing healthy and tumor tissue. Scale bars, 50 μm. (C) Representative images of immunofluorescent staining for basic cytokeratin (top, green), ACSL3 (red), nuclei (blue), and FAP (bottom, green) of KPC;Acsl3+/+ tumor-bearing pancreas sections. Scale bars, 70 μm. (D) Representative images of H&E-stained (top, left) and basic cytokeratin–stained (bottom, left) tumor-bearing pancreas sections and pancreas tumor area quantification (right) reported as percentage of tumor area per total pancreas area from H&E-stained mouse pancreas sections of KPC;Acsl3+/+ (n = 15) and KPC;Acsl3−/− (n = 8) mice. Scale bars, 70 μm (top) and 50 μm (bottom). (E) Representative images of Sirius red–stained (top) and Masson trichrome–stained (bottom) mouse pancreatic cancer sections of KPC;Acsl3+/+ and KPC;Acsl3−/− mice. Scale bars, 70 μm (left) and 30 μm (right). (F) Quantification of fibrosis based on Sirius red and Masson trichrome staining, respectively, reported as % of area occupancy over tumor area assessed on a representative pancreas section per mouse (n = 5 to 6 mice per group). (G) Representative immunofluorescence staining for basic cytokeratin, Ki67, and nuclei (Hoechst) (left) and relative quantification (right) of KPC;Acsl3+/+ and KPC;Acsl3−/− tumor-bearing pancreas sections. The quantifications are the average of 15 pictures per mouse (n = 5 mice per group). Scale bars, 50 μm. (H) Representative immunofluorescence staining for αSMA, Ki67, and nuclei (Hoechst) (left) and relative quantification (right) of KPC;Acsl3+/+ and KPC;Acsl3−/− pancreatic cancer tissue sections. The quantifications are the average of 15 pictures per mouse; n = 5 mice per group. Scale bars, 50 μm. Error bars represent mean ± SD; statistical analysis was performed using Student’s t test or one-way ANOVA. *P < 0.05 and **P < 0.01.
