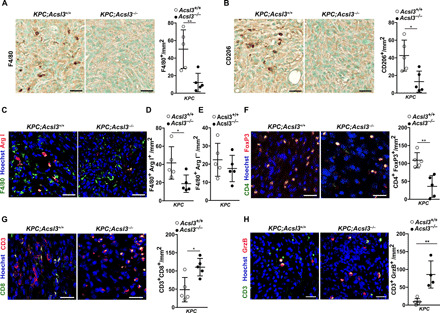
Fig. 3. ACSL3 drives tumor microenvironment toward immunosuppression.

(A and B) Representative images of IHC staining (left) and quantification (right) of F4/80 and CD206, respectively, in PDAC lesions of KPC;Acsl3+/+ and KPC;Acsl3−/− tumor-bearing pancreas sections; n = 5 mice per group. Scale bars, 50 μm. (C) Representative images of immunofluorescence costaining of the pan-macrophage marker F4/80 with the M2 macrophage marker Arg1 of KPC;Acsl3+/+ and KPC;Acsl3−/− tumor-bearing pancreas sections; n = 5 mice per group. Scale bars, 30 μm. (D and E) Quantifications from (C) expressed as double-positive (F4/80+/Arg1+) and single-positive (F4/80+/Arg1−) cells per mm2, respectively. The quantifications are the average of 15 pictures per mouse; n = 5 mice per group. (F) Representative images of immunofluorescence staining (left) and quantification (right) of CD4 (green), FoxP3 (red), and nuclei (blue) of KPC;Acsl3+/+ and KPC;Acsl3−/− tumor-bearing pancreas sections. The quantifications are the average of 15 pictures per mouse; n = 5 mice per group. Scale bars, 50 μm. (G) Representative images of immunofluorescence staining (left) and quantification (right) of CD3 and CD8, reported as positive cells per mm2 of KPC;Acsl3+/+ and KPC;Acsl3−/− tumor-bearing pancreas sections; n = 5 mice per group. Scale bars, 50 μm. (H) Representative images of immunofluorescence staining (left) and quantification (right) of CD3 and granzyme B (GrzB) reported as positive cells per mm2 of KPC;Acsl3+/+ (n = 5 mice per group) and KPC;Acsl3−/− (n = 4 mice per group) tumor-bearing pancreas sections. Scale bars, 50 μm. Error bars represent mean ± SD; statistical analysis was performed using unpaired Student’s t test. *P < 0.05 and **P < 0.01.
