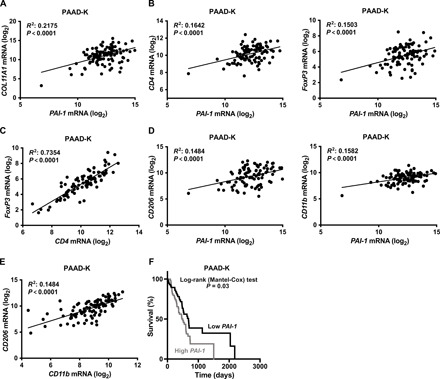
Fig. 5. PAI-1 correlates with immunosuppression and PDAC patient survival.

(A and B) Correlation between the expression level of fibrosis marker COL11A1 (A) or Treg markers CD4, FoxP3 (B), and PAI-1 expression level in subset PAAD-K from TCGA (only KRAS-mutant samples); n = 94. (C) Correlation between FoxP3 and CD4 expression level in human subset PAAD-K samples as in (A); n = 94. (D) Correlation between the expression level of macrophage markers CD206 (M2 macrophages marker) or CD11b and PAI-1 expression in subset PAAD-K samples as in (A); n = 94. (E) Correlation between the expression level of CD206 and CD11b in human subset PAAD-K samples as in (A); n = 94. (F) Kaplan-Meier plot showing survival of human PDAC patient stratified in high (n = 62) and low (n = 62) PAI-1 mRNA level from subset PAAD-K (only KRAS-mutant samples). Correlations were performed using the Pearson’s correlation analysis.
