
Fig. 2. Analysis of neutrophil pseudotime trajectories using SPADE culminates in a unique marker expression profile of a putative pro-angiogenic subpopulation.
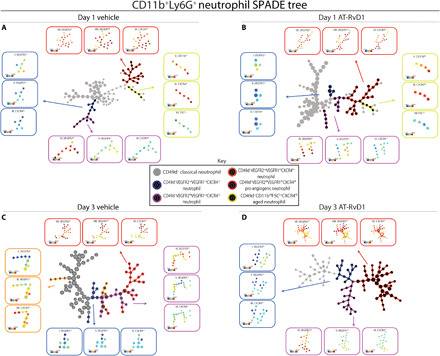
Pseudotime analysis generated SPADE trees consisting of CD11b+Ly6G+ neutrophils from tissue at day 1 after surgery with vehicle control (A), day 1 after surgery with sustained AT-RvD1 treatment (B), day 3 after surgery with a vehicle control (C), and day 3 after surgery with sustained AT-RvD1 treatment (D). Pseudotime trajectories show that distinct neutrophil phenotypes emerge. Day 1 after surgery shows the presence of an aged neutrophil phenotype (A and B). At day 3, the aged neutrophil subpopulation is not present, but the accumulation of pro-angiogenic neutrophils is notable in response to AT-RvD1 (D). The SPADE tree is annotated to distinguish the different subpopulations that emerge through pseudotime analysis. Gray nodes are CD49d− classical neutrophils, and black nodes are CD49d+ with color strokes separating these cells into separate neutrophil phenotypes based on functional markers. The expression level, in the form of a heatmap overlay onto the nodes, of these functional markers for every subpopulation is displayed as a call-out box. The following colors and their expression level of a combination of functional markers are the strokes and markers that separate the neutrophil phenotypes: blue, CD49d+VEGFR2Lo(I)VEGFR1Lo(II)CXCR4Lo(III); purple, CD49d+VEGFR2Hi(IV)VEGFR1Lo(V)CXCR4Lo(VI); orange, CD49d+VEGFR2Lo(X)VEGFR1Hi(XI)CXCR4Hi(XII); red, CD49d+VEGFR2Hi(VII)VEGFR1Hi(VIII)CXCR4Hi(IX) pro-angiogenic neutrophil; and yellow, CD49d+CD11bHi(X)CXCR4Hi(XI)FSCLo(XII) aged neutrophil. Each SPADE tree was constructed with pooled data of n = 4.