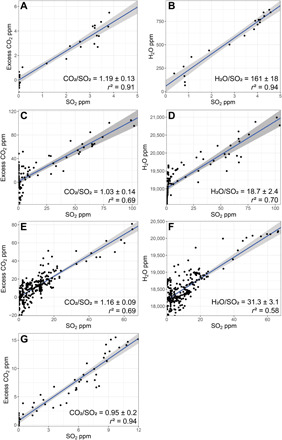
Fig. 3. Volcanic molar gas composition.

CO2-SO2 and H2O-SO2 regression scatterplots for (A and B) 30 October 2018 21:00 UTC (07:00 local time), (C and D) flight 1 on 22 May 2019 06:30 UTC (16:30 local time), (E and F) flight 2 on 23 May 2019 00:00 UTC (10:00 local time), and (G) flight 4 on 26 May 2019 00:00 UTC (10:00 local time). CO2 is shown as “excess,” where the background is taken as the y-axis intercept of the regression line. There is high variability in CO2 at low SO2 (dilute plume) conditions. Molar gas ratios are determined by least squares linear regression (solid blue line). Goodness of fit is shown by the adjusted r2 values. Gray shaded region represents the 95% confidence bounds on the regression. Data are from two Multi-GAS instruments: (A to F) Università di Palermo and (G) Chalmers University (see Materials and Methods for specifications).
