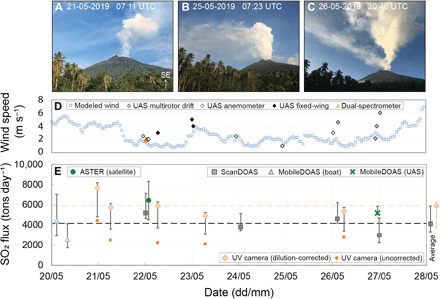
Fig. 4. SO2 flux measurements.

(A to C) Variability in plume height and direction during 21 to 27 May 2019. All images were taken from the location of the fixed scanning differential optical absorption spectrometry (ScanDOAS) instrument in Baliau (Fig. 2A), looking southeast. Image credit: E. J. Liu. (D) Summary of wind speeds in the horizontally dispersing plume measured directly by various techniques (see Materials and Methods) or modeled, assuming plume transport at 2000 m above summit altitude. (E) Summary of SO2 flux measurements at Manam during 20 to 27 May 2019. For the UV camera and ScanDOAS data, multiple measurements were acquired in a single sampling interval, and therefore, each point represents the mean value ± measurement uncertainty (see Materials and Methods). Dashed lines indicate the mean values over the whole campaign for UV camera (orange dashed line) and all DOAS combined (black dashed line); propagated uncertainties on the average values are shown on the right-hand side of the figure.
