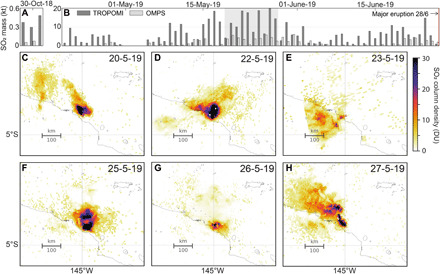
Fig. 5. Satellite retrievals of SO2 mass loadings.

Measurements from TROPOMI and OMPS, interpolated to a plume altitude of 3 km, are shown for the periods (A) 29 to 30 October 2018 and (B) 26 April to 26 June 2019 and interpolated to a plume altitude of 3 km. Note the different y-axis scales. Gray shaded regions highlight when field measurements are available. Uncertainties are reported in table S3. (C to H) Maps of SO2 column density for the campaign period 20 to 27 May 2019. Wind direction varied on time scales of hours to days, sometimes resulting in the appearance of two distinct plume directions in a single TROPOMI scene. Color scale is in Dobson units (DU), proportional to the number of molecules in a square centimeter of atmosphere. If all the SO2 in a column of atmosphere was compressed into a flat layer at standard temperature and pressure, one DU would be 0.01 mm thick and would contain 0.0285 g m−2 of SO2. Black pixels indicate >30 DU.
